Up to date
This page is up to date for Godot 4.2.
If you still find outdated information, please open an issue.
Przegląd narzędzi do debugowania
This guide will give you an overview of the available debugging tools in the engine.
Godot comes with a powerful debugger and profilers to track down bugs, inspect your game at runtime, monitor essential metrics, and measure performances. It also offers options to visualize collision boxes and navigation polygons in the running game.
Finally, you have options to debug the game running on a remote device and to reload changes to your scenes or your code while the game is running.
Debugger Panel
Many of Godot's debugging tools are part of the Debugger panel, which you can find information about in Debugger panel.
Debug menu options
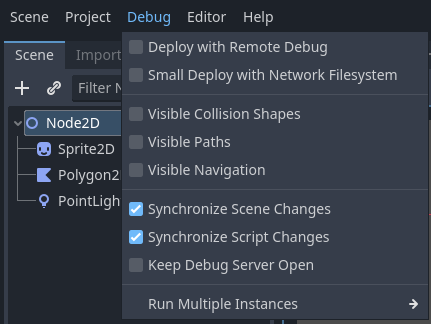
There are a few common debug options you can toggle on or off when running your game in the editor, which can help you in debugging your game.
You can find these options in the Debug editor menu.
Tutaj są opisy opcji:
Uruchom z użyciem zdalnego debugowania
When exporting and deploying, the resulting executable will attempt to connect to the IP of your computer for debugging.
Testuj z sieciowym systemem plików
This option speeds up testing for games with a large footprint on remote devices.
When Small Deploy with Network FS is on, instead of exporting the full game, deploying the game builds a minimal executable. The editor then provides files from the project over the network.
Also, on Android, the game is deployed using the USB cable to speed up deployment.
Widoczne kształty kolizji
This option makes collision shapes and raycast nodes visible in the running game.
Synchronizuj zmiany w scenie
With this option, any change you make to a scene in the editor at runtime appears instantly. When used remotely on a device, this is more efficient with the network filesystem.
Synchronizuj zmiany skryptów
Any script that is saved will be reloaded on the running game. When used remotely on a device, this is more efficient with the network filesystem.
Script editor debug tools and options
The script editor has its own set of debug tools for use with breakpoints and two options. The breakpoint tools can also be found in the Debugger tab of the debugger.
Wskazówka
You can create a breakpoint by clicking the gutter in the left of the script editor (on the left of the line numbers). When hovering this gutter, you will see a transparent red dot appearing, which turns into an opaque red dot after the breakpoint is placed by clicking. Click the red dot again to remove the breakpoint. Breakpoints created this way persist across editor restarts, even if the script wasn't saved when exiting the editor.
You can also use the breakpoint keyword in GDScript to create a
breakpoint that is stored in the script itself. Unlike breakpoints created by
clicking in the gutter, this keyword-based breakpoint is persistent across
different machines when using version control.
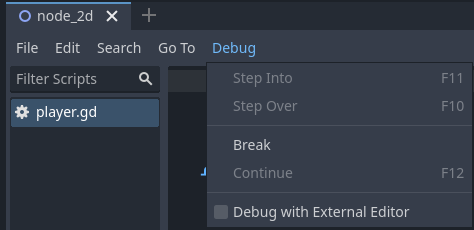
The Break button causes a break in the script like a breakpoint would. Continue makes the game continue after pausing at a breakpoint. Step Over goes to the next line of code, and Step Into goes into a function if possible. Otherwise, it does the same thing as Step Over.
The Keep Debugger Open option keeps the debugger open after a scene has been closed. The Debug with External Editor option lets you debug your game with an external editor. This option is also accessible in Editor Settings > Debugger.
When the debugger breaks on a breakpoint, a green triangle arrow is visible in the script editor's gutter. This arrow indicates the line of code the debugger broke on.
Debug project settings
In the project settings, there is a Debug category with three subcategories which control different things.
Ustawienia
These are some general settings such as printing the current FPS to the Output panel, the maximum amount of functions when profiling and others.
GDScript
These settings allow you to toggle specific GDScript warnings, such as for unused variables. You can also turn off warnings completely.
Shapes
Shapes are where you can adjust the color of shapes that only appear for debugging purposes, such as collision and navigation shapes.
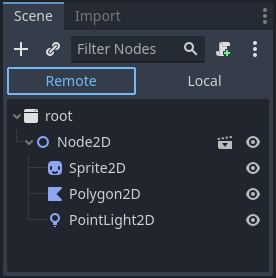
Remote in scene dock
When running a game in the editor two options appear at the top of the Scene dock, Remote and Local. While using Remote you can inspect or change the nodes' parameters in the running project.
Informacja
Some editor settings related to debugging can be found inside the Editor Settings, under the Network > Debug and Debugger sections.