Up to date
This page is up to date for Godot 4.2.
If you still find outdated information, please open an issue.
性能分析器
You run your game from Godot and play around. It's fun, it's becoming feature complete, and you feel it's getting close to release.
But then, you open the skill tree, and it grinds to a halt as something snags in your code. Watching the skill tree scroll by like it's a slide show is unacceptable. What went wrong? Is it positioning the skill tree elements, the UI, or rendering?
You could try to optimize everything and run the game repeatedly, but you can be smarter about this and narrow down the possibilities. Enter Godot's profiler.
An overview of the profiler
You can open the profiler by opening the Debugger panel and clicking on the Profiler tab.
Godot's profiler does not automatically run because profiling is performance-intensive. It has to continually measure everything happening in the game and report back to the debugger, so it's off by default.
To begin profiling, click on the Start button in the top-left. Run your game and data will start appearing. You can also start profiling at any time before or during gameplay, depending on if you want.
备注
The profiler does not currently support C# scripts. C# scripts can be profiled using JetBrains Rider and JetBrains dotTrace with the Godot support plugin.
You can clear the data by clicking the Clear button anytime. Use the Measure drop-down menu to change the type of data you measure. The measurements panel and the graph will update accordingly.
The measured data
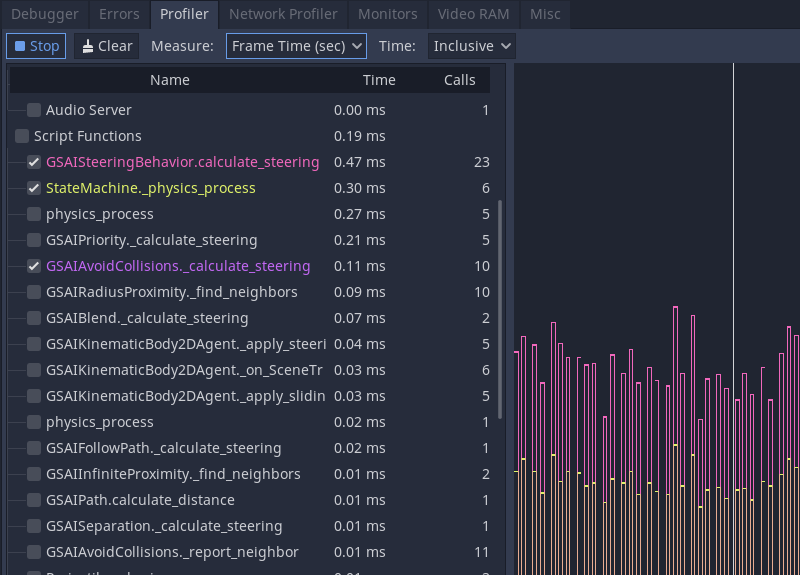
The profiler's interface is split into two. There is a list of functions on the left and the performance graph on the right.
The main measurements are frame time, physics frame, idle time, and physics time.
The frame time is the time it takes Godot to execute all the logic for an entire image, from physics to rendering.
Physics frame is the time Godot has allocated between physics updates. In an ideal scenario, the frame time is whatever you chose: 16.66 milliseconds by default, which corresponds to 60FPS. It's a frame of reference you can use for everything else around it.
Idle time is the time Godot took to update logic other than physics, such as code that lives in _process or timers and cameras set to update on Idle.
Physics time is the time Godot took to update physics tasks, like _physics_process and built-in nodes set to Physics update.
备注
In Godot 3, Frame Time includes rendering time. Say you find a mysterious spike of lag in your game, but your physics and scripts are all running fast. The delay could be due to the appearance of particles or visual effects!
By default, Godot ticks on Frame Time and Physics Time. This gives you an overview of how long each frame takes relative to the allocated desired physics FPS. You can toggle functions on and off by clicking the checkboxes on the left. Other facilities make appearances as you go down the list, like Physics 2D, Physics, and Audio, before reaching Script functions, where your code appears.
If you click on the graph, you change which frame's information appears on the left. In the top right, there is also a frame counter where you can manually adjust the frame you are looking at more granularly.
Scope of measurement and measurement windows
You can change what measurement you are looking at using the Measure drop-down menu. By default, it starts with Frame Time and lists the time it takes to go through the frame in milliseconds. The average time is the average time any given function took when called more than once. For example, a function that took 0.05 milliseconds to run five times should give you an average of 0.01 milliseconds.
If accurate milliseconds count is not important, and you want to see proportions of time relative to the rest of the frame, use percentage measurements. Frame % is relative to Frame Time, and Physics % is relative to Physics Time.
The last option is the scope of the time. Inclusive measures the time a function took with any nested function calls. For example:
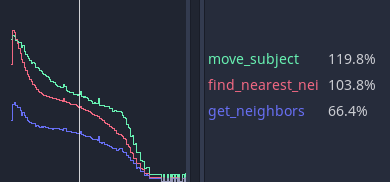
get_neighbors, find_nearest_neighbor and move_subject all took a lot of time. You could be fooled into thinking that this is because all three of them are slow.
But when changed to Self, Godot measures the time spent in the function body without considering function calls it made itself.
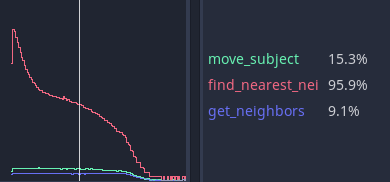
You can see that get_neighbors and move_subject have lost a lot of their importance. In effect, that means that get_neighbors and move_subject have spent more time waiting for some other function call to finish than not, and find_nearest_neighbor is actually slow.
Debugging slow code with the profiler
Finding slow code with the profiler boils down to running your game and watching the performance graph as it draws. When an unacceptable spike occurs in the frame time, you can click on the graph to pause your game and narrow the _Frame #_ to the spike's start. You may need to jump back and forth between frames and functions to find the root cause.
Under the Script functions, turn on the checkboxes for some functions to find which take time. These are the functions you need to review and optimize.
Measuring manually in microseconds
如果函数比较复杂,那么找出需要优化的部分可能会很困难。是数学的问题,还是获取进行数学运算所需数据的方式的问题?是 for 循环吗?还是 if 语句?
你可以让程序运行一些临时函数,手动计算时刻,来缩小测量范围。有两个属于 Time 类对象的函数,分别是 get_ticks_msec 和 get_ticks_usec 。第一个会以毫秒为单位(每秒为1,000毫秒)测量,而第二个则以微秒为单位(每秒为1,000,000微秒)测量。
两者都会以各自的时间量返回游戏引擎启动以来经过的时间。
如果使用微秒的开始和结束包裹一段代码,那两者的差则是运行这段代码花费的时间。
# Measuring the time it takes for worker_function() to run
var start = Time.get_ticks_usec()
worker_function()
var end = Time.get_ticks_usec()
var worker_time = (end-start)/1000000.0

# Measuring the time spent running a calculation over each element of an array
start = Time.get_ticks_usec()
for calc in calculations:
    result = pow(2, calc.power) * calc.product
end = Time.get_ticks_usec()
var loop_time = (end-start)/1000000.0

print("Worker time: %s\nLoop time: %s" % [worker_time, loop_time])
As you become a more experienced programmer, this technique becomes less necessary. You begin to learn what parts of a running program are slow. Knowing that loops and branches can be slow comes from experience, and you gain experience by measuring and doing research.
But between the profiler and the ticks functions, you should have enough to get started finding which parts of your code need optimization.