Up to date
This page is up to date for Godot 4.2.
If you still find outdated information, please open an issue.
Debugger panel
Many of Godot's debugging tools, including the debugger, can be found in the debugger panel at the bottom of the screen. Click on Debugger to open it.
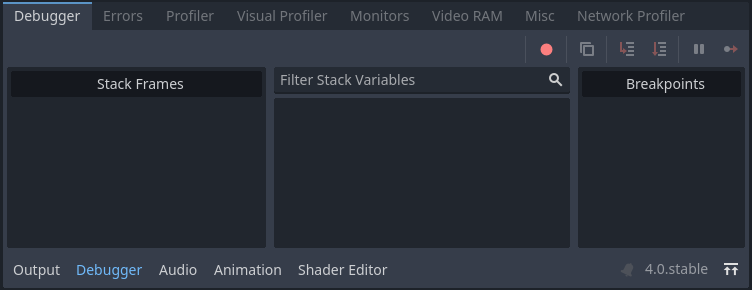
The debugger panel is split into several tabs, each focusing on a specific task.
デバッガー
The Debugger tab opens automatically when the GDScript compiler reaches a breakpoint in your code.
It gives you a stack trace, information about the state of the object, and buttons to control the program's execution. When the debugger breaks on a breakpoint, a green triangle arrow is visible in the script editor's gutter. This arrow indicates the line of code the debugger broke on.
ちなみに
You can create a breakpoint by clicking the gutter in the left of the script editor (on the left of the line numbers). When hovering this gutter, you will see a transparent red dot appearing, which turns into an opaque red dot after the breakpoint is placed by clicking. Click the red dot again to remove the breakpoint. Breakpoints created this way persist across editor restarts, even if the script wasn't saved when exiting the editor.
You can also use the breakpoint keyword in GDScript to create a
breakpoint that is stored in the script itself. Unlike breakpoints created by
clicking in the gutter, this keyword-based breakpoint is persistent across
different machines when using version control.
You can use the buttons in the top-right corner to:
すべてのブレークポイントをスキップします。これにより、将来のデバッグセッションのためにブレークポイントを保存できます。
現在のエラーメッセージをコピーします。
ステップイン。このボタンを使用すると、次のコード行に移動し、そこが関数の場合は、関数内を1行ずつステップ実行します。
ステップオーバー。このボタンはコードの次の行に移動しますが、関数を1行ずつステップ実行しません。
ブレーク。このボタンは、ゲームの実行を一時停止します。
実行を継続。このボタンは、ブレークポイントまたは一時停止後にゲームを再開します。
エラー
This is where error and warning messages are printed while running the game.
プロジェクト設定 > デバッグ > GDScript で特定の警告を無効にすることができます。
プロファイラ
The profiler is used to see what code is running while your project is in use, and how that effects performance.
参考
A detailed explanation of how to use the profiler can be found in the dedicated The Profiler page.
Visual Profiler
The Visual Profiler can be used to monitor what is taking the most time when rendering a frame on the CPU and GPU respectively. This allows tracking sources of potential CPU and GPU bottlenecks caused by rendering.
警告
The Visual Profiler only measures CPU time taken for rendering tasks, such as performing draw calls. The Visual Profiler does not include CPU time taken for other tasks such as scripting and physics. Use the standard Profiler tab to track non-rendering-related CPU tasks.
To use the visual profiler, run the project, switch to the Visual Profiler tab within the Debugger bottom panel, then click Start:
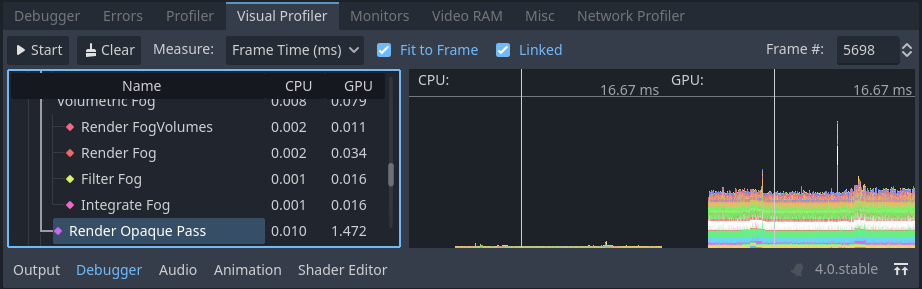
Visual Profiler tab after clicking Start, waiting for a few seconds, then clicking Stop
You will see categories and results appearing as the profiler is running. Graph lines also appear, with the left side being a CPU framegraph and the right side being a GPU framegraph.
Click Stop to finish profiling, which will keep the results visible but frozen in place. Results remain visible after stopping the running project, but not after exiting the editor.
Click on result categories on the left to highlight them in the CPU and GPU graphs on the right. You can also click on the graph to move the cursor to a specific frame number and highlight the selected data type in the result categories on the left.
You can switch the result display between a time value (in milliseconds per frame) or a percentage of the target frametime (which is currently hardcoded to 16.67 milliseconds, or 60 FPS).
If framerate spikes occur during profiling, this can cause the graph to be poorly scaled. Disable Fit to Frame so that the graph will zoom onto the 60 FPS+ portion.
注釈
Remember that Visual Profiler results can vary heavily based on
viewport resolution, which is determined by the window size if using the
disabled or canvas_items stretch modes.
When comparing results across different runs, make sure to use the same viewport size for all runs.
Visual Profiler is supported when using any rendering method (Forward+, Mobile or Compatibility), but the reported categories will vary depending on the current rendering method as well as the enabled graphics features. For example, when using Forward+, a simple 2D scene with shadow-casting lights will result in the following categories appearing:
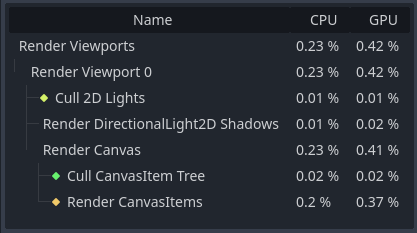
Example results from a 2D scene in the Visual Profiler
To give another example with Forward+, a 3D scene with shadow-casting lights and various effects enabled will result in the following categories enabled:
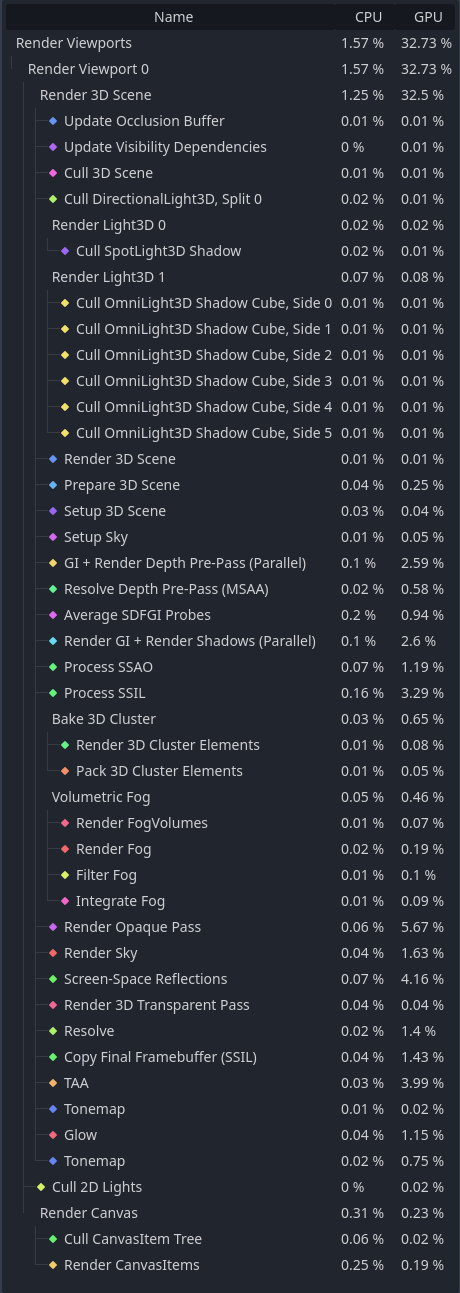
Example results from a 3D scene in the Visual Profiler
Notice how in the 3D example, several of the categories have (Parallel) appended to their name. This hints that multiple tasks are being performed in parallel on the GPU. This generally means that disabling only one of the features involved won't improve performance as much as anticipated, as the other task still needs to be performed sequentially.
ネットワークプロファイラー
ネットワークプロファイラーには、マルチプレイヤーAPIを介して通信するすべてのノードのリストと、各ノードについて、着信および発信ネットワークインタラクションの量に関するカウンターが含まれています。また、任意の時点での総帯域幅使用量を表示する帯域幅メーターも備えています。
注釈
The bandwidth meter does not take the High-level multiplayer API's own compression system into account. This means that changing the compression algorithm used will not change the metrics reported by the bandwidth meter.
モニター
モニターは、ゲームの複数の側面をグラフ化したもので、FPS、メモリ使用量、シーン内のノード数など、ゲームの動作を示します。すべてのモニターは統計を自動的に追跡するため、ゲームの実行中にモニターを1つも開いていなくても、後で開いて値の変化を確認できます。
参考
In addition to the default performance monitors, you can also create custom performance monitors to track arbitrary values in your project.
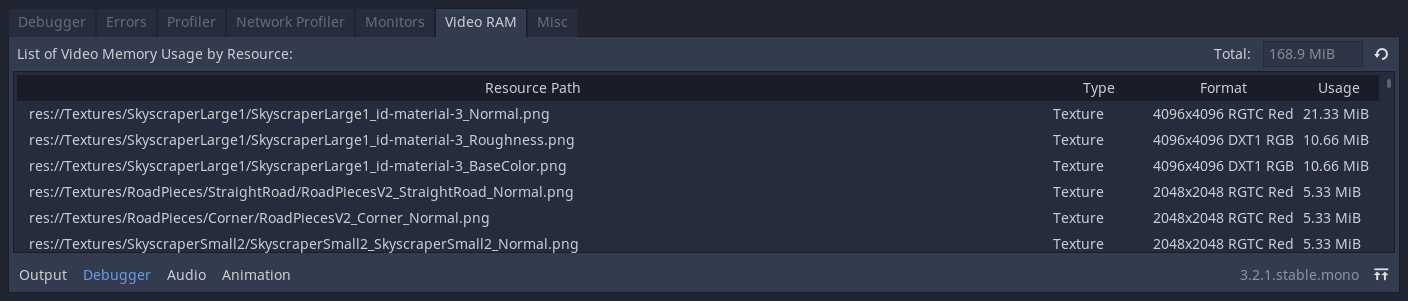
ビデオRAM
The Video RAM tab shows the video RAM usage of the game while it is running. It provides a list of every resource using video RAM by resource path, the type of resource it is, what format it is in, and how much Video RAM that resource is using. There is also a total video RAM usage number at the top right of the panel.
その他
[その他]タブには、実行時にクリックしているコントロールノードを識別するツールが含まれています:
クリックされたコントロール は、クリックされたノードがシーンツリーのどこにあるかを示します。
Clicked Control Type は、クリックしたノードのタイプを示します。