Debugger panel
Many of Godot's debugging tools, including the debugger, can be found in the debugger panel at the bottom of the screen. Click on Debugger to open it.
The debugger panel is split into several tabs, each focusing on a specific task.
Debugger
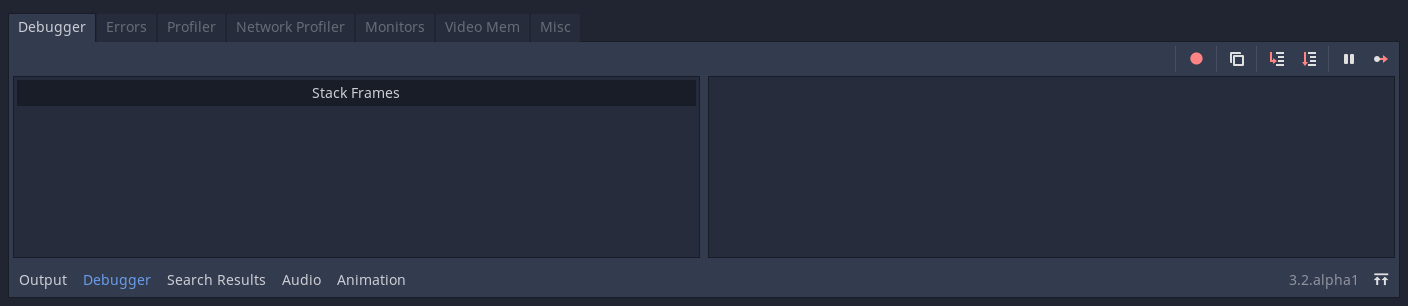
The Debugger tab opens automatically when the GDScript compiler reaches a breakpoint in your code.
It gives you a stack trace, information about the state of the object, and buttons to control the program's execution.
You can use the buttons in the top-right corner to:
Skip all breakpoints. That way, you can save breakpoints for future debugging sessions.
Copy the current error message.
Step Into the code. This button takes you to the next line of code, and if it's a function, it steps line-by-line through the function.
Step Over the code. This button goes to the next line of code, but it doesn't step line-by-line through functions.
Break. This button pauses the game's execution.
Continue. This button resumes the game after a breakpoint or pause.
Warning
Breakpoints won't break on code if it's running in a thread. This is a current limitation of the GDScript debugger.
Errors
This is where error and warning messages are printed while running the game.
You can disable specific warnings in Project Settings > Debug > GDScript.
Profiler
The debugger comes with three profilers for your processor, network operations, and video memory.
The profiler is used to show why individual frames take as long as they do to process and render.
Unlike other debugging tools, the profiler does not start automatically. It can be started at any time during gameplay by pressing the start button. You can even start the profiler before opening the game to profile startup performance. It can also be started and stopped while the game is running without losing information from when it was last running. The information it records won't go away unless you click clear, or close the game, reopen it and start the profiler again.
After starting and stopping the profiler, you should see things being kept track of on the left and a graph on the right. The items listed on the left are everything that contributes to frame time, and they should each have a value for time and calls for the current frame you are looking at.
The frame number in the top right tells you which frame you are currently looking at. You can change this by using the up or down arrows, typing in the frame number, or clicking on the graph.
If you want to add something to your graph or think it looks too cluttered, you can check and uncheck the box next to an item to add or remove it from the graph.
Network Profiler
The Network Profiler contains a list of all the nodes that communicate over the multiplayer API and, for each one, some counters on the amount of incoming and outgoing network interactions. It also features a bandwidth meter that displays the total bandwidth usage at any given moment.
Monitors
The monitors are graphs of several aspects of the game while its running such as FPS, memory usage, how many nodes are in a scene and more. All monitors keep track of stats automatically, so even if one monitor isn't open while the game is running, you can open it later and see how the values changed.
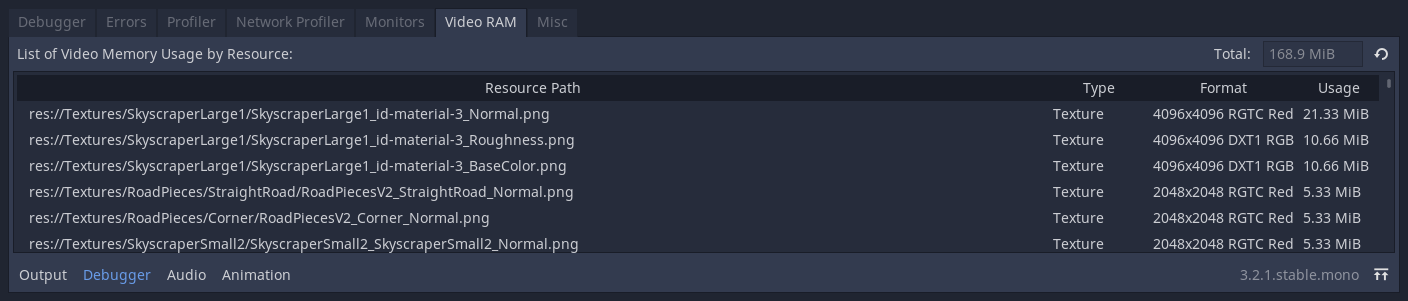
Video RAM
The Video RAM tab shows the video RAM usage of the game while it is running. It provides a list of every resource using video RAM by resource path, the type of resource it is, what format it is in, and how much Video RAM that resource is using. There is also a total video RAM usage number at the top right of the panel.
Misc
The Misc tab contains tools to identify the control nodes you are clicking at runtime:
Clicked Control tells you where the clicked node is in the scene tree.
Clicked Control Type tells you the type of the node you clicked is.