Attention: Here be dragons
This is the latest
(unstable) version of this documentation, which may document features
not available in or compatible with released stable versions of Godot.
Checking the stable version of the documentation...
2D 中的自定义绘图
介绍
Godot 有用于绘制精灵、多边形、粒子、文本以及其它各种游戏开发所需东西的节点。但是,如果这些标准节点不能满足你的特定需求,你可以通过自定义命令在屏幕上绘制任何 2D 节点(例如,基于 Control 或 Node2D )。
2D 节点中的自定义绘制非常有用。下面是一些用例:
绘制现有节点类型无法完成的形状或逻辑,例如带有尾迹或特殊动态多边形的图像。
绘制大量简单的对象,例如 2D 游戏中的一个栅格或一个面板。自定义绘制避免了使用大量节点的开销,能降低内存占用,并提高性能。
制作自定义的 UI 控件,以满足很多可用的控件之外的特别需求。
绘制
添加一个脚本到任何 CanvasItem 的派生节点,如 Control 或 Node2D。然后重载 _draw() 函数。
extends Node2D

func _draw():
    pass  # Your draw commands here.
using Godot;

public partial class MyNode2D : Node2D
{
    public override void _Draw()
    {
        // Your draw commands here.
    }
}
绘制命令在 CanvasItem 的类参考中有所描述。绘制命令的数量很多,我们将在下面的示例中看到一些。
更新
_draw 函数只调用一次,然后绘制命令被缓存并记住,因此不需要进一步调用。
如果因为状态或其他方面的变化而需要重新绘制,在当前节点中调用 CanvasItem.queue_redraw ,触发新的 _draw() 调用。
这是一个稍微复杂一点的例子,我们有一个可以被随时修改的纹理变量,并且使用一个 setter,它在纹理被修改时强制一次该纹理的重绘:
extends Node2D

@export var texture : Texture2D:
    set(value):
        texture = value
        queue_redraw()

func _draw():
    draw_texture(texture, Vector2())
using Godot;

public partial class MyNode2D : Node2D
{
    private Texture2D _texture;

    [Export]
    public Texture2D Texture
    {
        get
        {
            return _texture;
        }

        set
        {
            _texture = value;
            QueueRedraw();
        }
    }

    public override void _Draw()
    {
        DrawTexture(_texture, new Vector2());
    }
}
为了直观地看到这一功能,你可以通过将默认的 icon.svg 文件从 文件系统 标签拖放到 检查器 标签上的纹理属性,将编辑器中的纹理设置为 Godot 图标。当先前脚本运行时更改 纹理 属性值,纹理也将自动更改。
在某些情况下,需要绘制每一帧。 为此,可以像这样从 _process 方法中调用 queue_redraw 方法:
extends Node2D

func _draw():
    pass  # Your draw commands here.

func _process(_delta):
    queue_redraw()
using Godot;

public partial class MyNode2D : Node2D
{
    public override void _Draw()
    {
        // Your draw commands here.
    }

    public override void _Process(double delta)
    {
        QueueRedraw();
    }
}
坐标和线宽对齐
绘图 API 使用的是 CanvasItem 的坐标系,不一定是像素坐标。这意味着 _draw() 使用的是应用 CanvasItem 的变换后创建的坐标空间。此外,你还可以使用 draw_set_transform 或 draw_set_transform_matrix 在其上方应用自定义变换。
当使用 draw_line 时,你应该考虑线的宽度。当使用奇数宽度时,为了使线保持居中,起点和终点的位置应该偏移 0.5 ,如下所示。
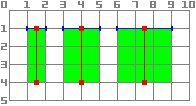
func _draw():
    draw_line(Vector2(1.5, 1.0), Vector2(1.5, 4.0), Color.GREEN, 1.0)
    draw_line(Vector2(4.0, 1.0), Vector2(4.0, 4.0), Color.GREEN, 2.0)
    draw_line(Vector2(7.5, 1.0), Vector2(7.5, 4.0), Color.GREEN, 3.0)
public override void _Draw()
{
    DrawLine(new Vector2(1.5f, 1.0f), new Vector2(1.5f, 4.0f), Colors.Green, 1.0f);
    DrawLine(new Vector2(4.0f, 1.0f), new Vector2(4.0f, 4.0f), Colors.Green, 2.0f);
    DrawLine(new Vector2(7.5f, 1.0f), new Vector2(7.5f, 4.0f), Colors.Green, 3.0f);
}
与使用 filled = false 的 draw_rect 方法相同。
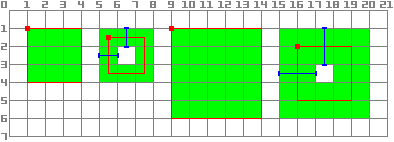
func _draw():
    draw_rect(Rect2(1.0, 1.0, 3.0, 3.0), Color.GREEN)
    draw_rect(Rect2(5.5, 1.5, 2.0, 2.0), Color.GREEN, false, 1.0)
    draw_rect(Rect2(9.0, 1.0, 5.0, 5.0), Color.GREEN)
    draw_rect(Rect2(16.0, 2.0, 3.0, 3.0), Color.GREEN, false, 2.0)
public override void _Draw()
{
    DrawRect(new Rect2(1.0f, 1.0f, 3.0f, 3.0f), Colors.Green);
    DrawRect(new Rect2(5.5f, 1.5f, 2.0f, 2.0f), Colors.Green, false, 1.0f);
    DrawRect(new Rect2(9.0f, 1.0f, 5.0f, 5.0f), Colors.Green);
    DrawRect(new Rect2(16.0f, 2.0f, 3.0f, 3.0f), Colors.Green, false, 2.0f);
}
抗锯齿绘图
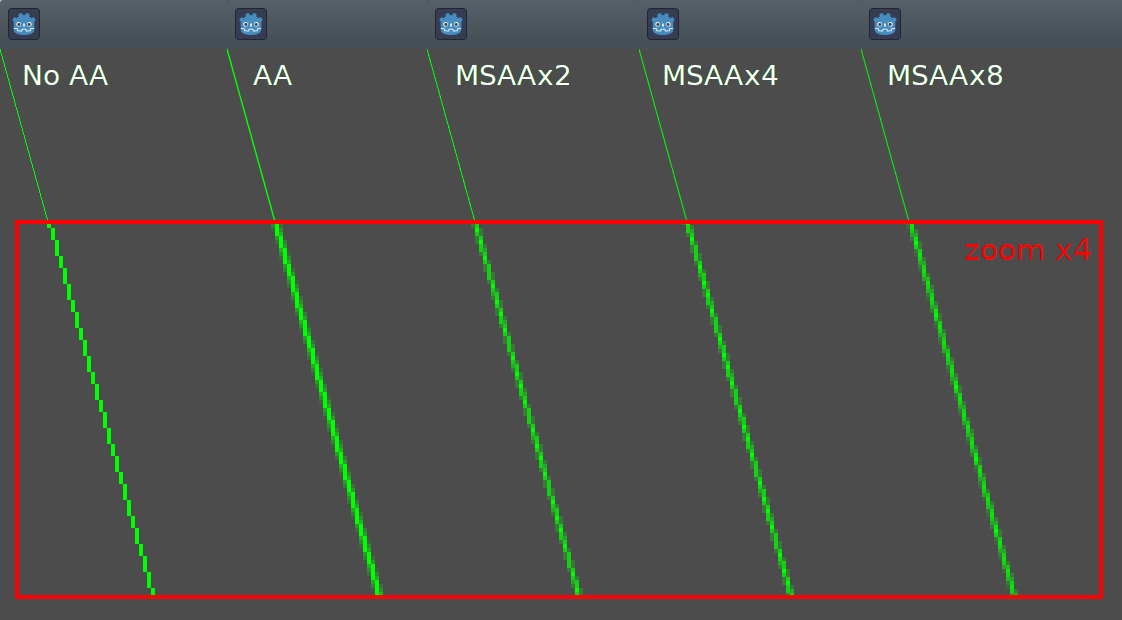
Godot 在 draw_line 方法中提供参数来启用抗锯齿功能,但并非所有自定义绘图方法都提供这个 抗锯齿(antialiased) 参数。
对于不提供 antialiased 参数的自定义绘图方法,你可以启用 2D MSAA,这会影响整个视口的渲染。这个功能(2D MSAA)提供了高质量的抗锯齿,但性能成本更高,而且只适用于特定元素。详情见 2D 抗锯齿。
最小宽度线段 (width=-1) 的对比,分别启用 antialiased=false 、 antialiased=true 以及 antialiased=false 搭配 2D MSAA 2x、4x 和 8x 抗锯齿。
工具
运行于编辑器中时,也可能需要绘制自己的节点。这可以用于预览或可视化某些特性或行为。
示例 1:绘制自定义形状
我们将使用 Godot 引擎的自定义绘制功能来绘制 Godot 本身没有提供函数的图形。将仅使用绘图函数重新创建 Godot 标志。
你需要编写一个函数来执行此操作并自行绘制。
备注
以下说明使用了一组固定坐标,该坐标对于高分辨率屏幕(大于 1080p)可能太小。如果是这种情况,并且绘图太小,请考虑在 菜单 > 项目 > 项目设置 > 显示/窗口/拉伸/缩放 中增加窗口缩放比例,以将项目调整到更高的分辨率(2 或 4 倍缩放通常效果良好)。
绘制自定义多边形形状
虽然存在用于绘制自定义多边形的专用节点 (Polygon2D),但本例中将仅使用更底层的绘制函数,以便将它们组合在同样的节点上,并能够在之后创建更复杂的形状。
我们将首先定义一组点(或 X 和 Y 坐标),它们将构成形状的基础:
extends Node2D

var coords_head : Array = [
    [ 22.952, 83.271 ],  [ 28.385, 98.623 ],
    [ 53.168, 107.647 ], [ 72.998, 107.647 ],
    [ 99.546, 98.623 ],  [ 105.048, 83.271 ],
    [ 105.029, 55.237 ], [ 110.740, 47.082 ],
    [ 102.364, 36.104 ], [ 94.050, 40.940 ],
    [ 85.189, 34.445 ],  [ 85.963, 24.194 ],
    [ 73.507, 19.930 ],  [ 68.883, 28.936 ],
    [ 59.118, 28.936 ],  [ 54.494, 19.930 ],
    [ 42.039, 24.194 ],  [ 42.814, 34.445 ],
    [ 33.951, 40.940 ],  [ 25.637, 36.104 ],
    [ 17.262, 47.082 ],  [ 22.973, 55.237 ]
]
using Godot;

public partial class MyNode2D : Node2D
{
    private float[,] _coordsHead =
    {
        { 22.952f, 83.271f },  { 28.385f, 98.623f },
        { 53.168f, 107.647f }, { 72.998f, 107.647f },
        { 99.546f, 98.623f },  { 105.048f, 83.271f },
        { 105.029f, 55.237f }, { 110.740f, 47.082f },
        { 102.364f, 36.104f }, { 94.050f, 40.940f },
        { 85.189f, 34.445f },  { 85.963f, 24.194f },
        { 73.507f, 19.930f },  { 68.883f, 28.936f },
        { 59.118f, 28.936f },  { 54.494f, 19.930f },
        { 42.039f, 24.194f },  { 42.814f, 34.445f },
        { 33.951f, 40.940f },  { 25.637f, 36.104f },
        { 17.262f, 47.082f },  { 22.973f, 55.237f }
    };
}
这是一种简洁的格式,但并不是 Godot 用于绘制多边形所理解的格式。在其他情况下,我们可能需要从文件中加载这些坐标或在应用程序运行时计算它们的位置,因此可能需要进行一些转换。
为了将这些坐标转换为正确的格式,我们将创建一个新的方法 float_array_to_Vector2Array()。然后我们将重写 _ready() 函数,Godot 将仅在执行开始时调用该函数一次,以将这些坐标加载到变量中:
var head : PackedVector2Array

func float_array_to_Vector2Array(coords : Array) -> PackedVector2Array:
    # Convert the array of floats into a PackedVector2Array.
    var array : PackedVector2Array = []
    for coord in coords:
        array.append(Vector2(coord[0], coord[1]))
    return array

func _ready():
    head = float_array_to_Vector2Array(coords_head);
private Vector2[] _head;

private Vector2[] FloatArrayToVector2Array(float[,] coords)
{
    // Convert the array of floats into an array of Vector2.
    int size = coords.GetUpperBound(0);
    Vector2[] array = new Vector2[size + 1];
    for (int i = 0; i <= size; i++)
    {
        array[i] = new Vector2(coords[i, 0], coords[i, 1]);
    }
    return array;
}

public override void _Ready()
{
    _head = FloatArrayToVector2Array(_coordsHead);
}
为了最终绘制第一个形状,我们将使用 draw_polygon 方法,并传递点( Vector2 坐标数组)及其颜色,如下所示:
func _draw():
    # We are going to paint with this color.
    var godot_blue : Color = Color("478cbf")
    # We pass the PackedVector2Array to draw the shape.
    draw_polygon(head, [ godot_blue ])
public override void _Draw()
{
    // We are going to paint with this color.
    Color godotBlue = new Color("478cbf");
    // We pass the array of Vector2 to draw the shape.
    DrawPolygon(_head, [godotBlue]);
}
运行后,你应该会看到类似以下的图形:
注意图标的下部看起来像是分段的,这是因为用于定义该部分的点数量较少。为了模拟平滑曲线,可以向数组中添加更多点,或者使用数学函数来插值曲线以从代码中创建平滑形状(参见 示例 2)。
多边形为了形成封闭的形状,总是会将 最后一个定义的点连接到第一个点 。
绘制连接线
绘制一系列不封闭成多边形的连接线与之前的方法非常相似。我们将使用一系列连接的线条来绘制 Godot 图标的嘴巴。
首先,我们将定义构成嘴巴形状的坐标列表,如下所示:
var coords_mouth = [
    [ 22.817, 81.100 ], [ 38.522, 82.740 ],
    [ 39.001, 90.887 ], [ 54.465, 92.204 ],
    [ 55.641, 84.260 ], [ 72.418, 84.177 ],
    [ 73.629, 92.158 ], [ 88.895, 90.923 ],
    [ 89.556, 82.673 ], [ 105.005, 81.100 ]
]
private float[,] _coordsMouth =
{
    { 22.817f, 81.100f }, { 38.522f, 82.740f },
    { 39.001f, 90.887f }, { 54.465f, 92.204f },
    { 55.641f, 84.260f }, { 72.418f, 84.177f },
    { 73.629f, 92.158f }, { 88.895f, 90.923f },
    { 89.556f, 82.673f }, { 105.005f, 81.100f }
};
我们将把这些坐标加载到一个变量中,并定义另一个变量来设置可配置的线条粗细:
var mouth : PackedVector2Array
var _mouth_width : float = 4.4

func _ready():
    head = float_array_to_Vector2Array(coords_head);
    mouth = float_array_to_Vector2Array(coords_mouth);
private Vector2[] _mouth;
private float _mouthWidth = 4.4f;

public override void _Ready()
{
    _head = FloatArrayToVector2Array(_coordsHead);
    _mouth = FloatArrayToVector2Array(_coordsMouth);
}
最终我们使用方法 draw_polyline 来真正绘制这条线,就像这样:
func _draw():
    # We will use white to draw the line.
    var white : Color = Color.WHITE
    var godot_blue : Color = Color("478cbf")

    draw_polygon(head, [ godot_blue ])

    # We draw the while line on top of the previous shape.
    draw_polyline(mouth, white, _mouth_width)
public override void _Draw()
{
    // We will use white to draw the line.
    Color white = Colors.White;
    Color godotBlue = new Color("478cbf");

    DrawPolygon(_head, [godotBlue]);

    // We draw the while line on top of the previous shape.
    DrawPolyline(_mouth, white, _mouthWidth);
}
你应当获得如下输出:
与 draw_polygon() 不同,折线(polyline)的所有点只能有一个唯一的颜色(第二个参数)。此方法有 2 个附加参数:线的宽度(默认情况下尽可能小),和启用或禁用抗锯齿(默认情况下禁用)。
_draw 调用的顺序很重要,就像树状层次结构上的节点位置一样,将从上到下绘制不同的形状,这会使得新绘制的形状在重叠时隐藏掉较早绘制的形状。在本例中,我们希望将嘴放在头上,因此我们将其放在后面。
请注意我们如何以不同的方式定义颜色,无论是使用十六进制代码还是预定义的颜色名称。请检查类 Color 的其他常量和定义颜色的方法。
绘制圆
为了创建眼睛,我们将添加 4 个额外的调用来绘制不同大小、颜色和位置的眼睛形状。
为了绘制圆形,请使用 draw_circle 方法根据其圆的中心定位它。第一个参数是以 Vector2 形式写下的中心坐标,第二个参数是其半径,第三个参数是其颜色:
func _draw():
    var white : Color = Color.WHITE
    var godot_blue : Color = Color("478cbf")
    var grey : Color = Color("414042")

    draw_polygon(head, [ godot_blue ])
    draw_polyline(mouth, white, _mouth_width)

    # Four circles for the 2 eyes: 2 white, 2 grey.
    draw_circle(Vector2(42.479, 65.4825), 9.3905, white)
    draw_circle(Vector2(85.524, 65.4825), 9.3905, white)
    draw_circle(Vector2(43.423, 65.92), 6.246, grey)
    draw_circle(Vector2(84.626, 66.008), 6.246, grey)
public override void _Draw()
{
    Color white = Colors.White;
    Color godotBlue = new Color("478cbf");
    Color grey = new Color("414042");

    DrawPolygon(_head, [godotBlue]);
    DrawPolyline(_mouth, white, _mouthWidth);

    // Four circles for the 2 eyes: 2 white, 2 grey.
    DrawCircle(new Vector2(42.479f, 65.4825f), 9.3905f, white);
    DrawCircle(new Vector2(85.524f, 65.4825f), 9.3905f, white);
    DrawCircle(new Vector2(43.423f, 65.92f), 6.246f, grey);
    DrawCircle(new Vector2(84.626f, 66.008f), 6.246f, grey);
}
在执行它时,你应当获得如下所示的图像:
对于部分未填充的圆弧(某些任意角度之间的圆形部分),可以使用方法 draw_arc。
绘制线
为了绘制最终的形状(鼻子),我们将使用一条线来近似模拟它。
通过提供其开始和结束坐标作为参数,draw_line 可用于绘制单个线段,如下所示:
func _draw():
    var white : Color = Color.WHITE
    var godot_blue : Color = Color("478cbf")
    var grey : Color = Color("414042")

    draw_polygon(head, [ godot_blue ])
    draw_polyline(mouth, white, _mouth_width)
    draw_circle(Vector2(42.479, 65.4825), 9.3905, white)
    draw_circle(Vector2(85.524, 65.4825), 9.3905, white)
    draw_circle(Vector2(43.423, 65.92), 6.246, grey)
    draw_circle(Vector2(84.626, 66.008), 6.246, grey)

    # Draw a short but thick white vertical line for the nose.
    draw_line(Vector2(64.273, 60.564), Vector2(64.273, 74.349), white, 5.8)
public override void _Draw()
{
    Color white = Colors.White;
    Color godotBlue = new Color("478cbf");
    Color grey = new Color("414042");

    DrawPolygon(_head, [godotBlue]);
    DrawPolyline(_mouth, white, _mouthWidth);
    DrawCircle(new Vector2(42.479f, 65.4825f), 9.3905f, white);
    DrawCircle(new Vector2(85.524f, 65.4825f), 9.3905f, white);
    DrawCircle(new Vector2(43.423f, 65.92f), 6.246f, grey);
    DrawCircle(new Vector2(84.626f, 66.008f), 6.246f, grey);

    // Draw a short but thick white vertical line for the nose.
    DrawLine(new Vector2(64.273f, 60.564f), new Vector2(64.273f, 74.349f),
             white, 5.8f);
}
你现在应该可以在屏幕上看到如下形状:
请注意,如果要同时绘制多条未连接的线,可以通过使用 draw_multiline 方法在一次调用中绘制所有线,来获得额外的性能提升。
绘制文本
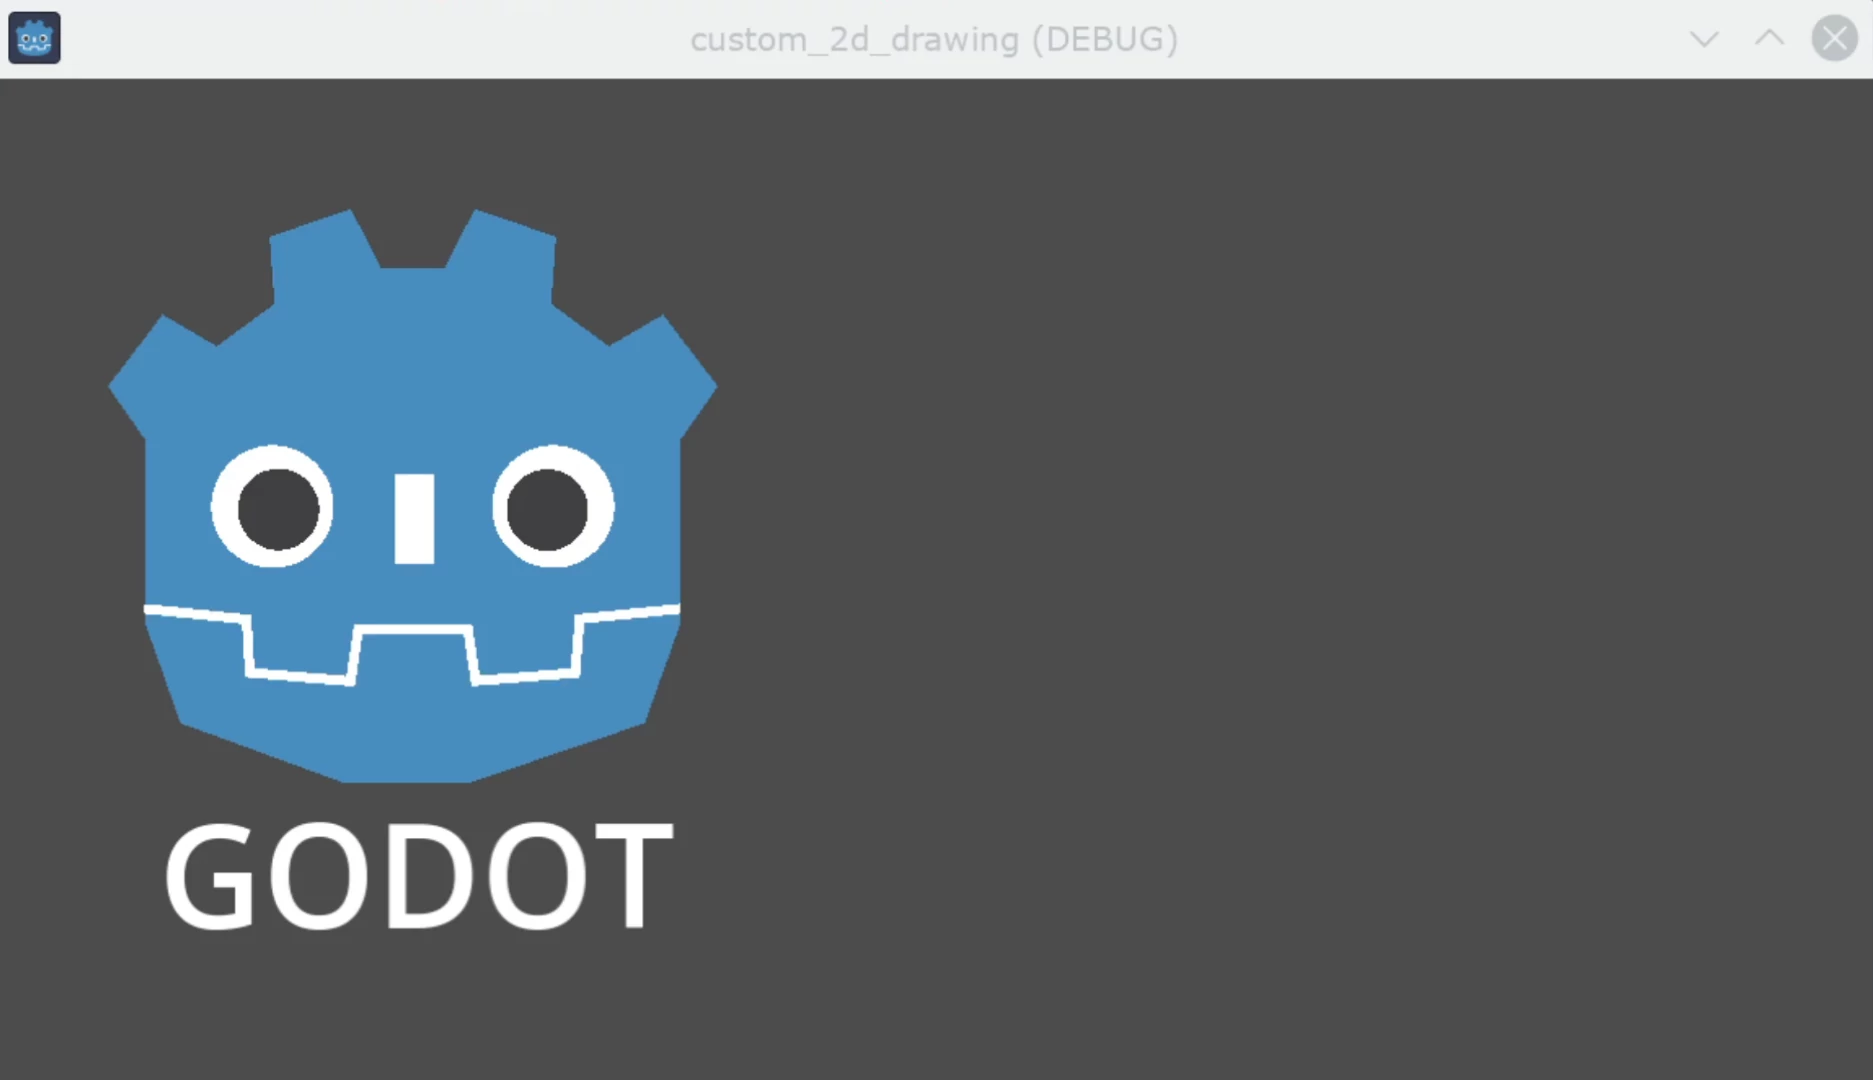
虽然向程序中添加文本的最常见方法是使用 Label 节点,但是低阶的 _draw 函数提供了在自定义 Node 绘制时添加文本的功能。我们就用这个方法在机器人的脑袋下面加上它的名字“GODOT”。
具体做法是调用 draw_string,类似于这样:
var default_font : Font = ThemeDB.fallback_font;

func _draw():
    var white : Color = Color.WHITE
    var godot_blue : Color = Color("478cbf")
    var grey : Color = Color("414042")

    draw_polygon(head, [ godot_blue ])
    draw_polyline(mouth, white, _mouth_width)
    draw_circle(Vector2(42.479, 65.4825), 9.3905, white)
    draw_circle(Vector2(85.524, 65.4825), 9.3905, white)
    draw_circle(Vector2(43.423, 65.92), 6.246, grey)
    draw_circle(Vector2(84.626, 66.008), 6.246, grey)
    draw_line(Vector2(64.273, 60.564), Vector2(64.273, 74.349), white, 5.8)

    # Draw GODOT text below the logo with the default font, size 22.
    draw_string(default_font, Vector2(20, 130), "GODOT",
                HORIZONTAL_ALIGNMENT_CENTER, 90, 22)
private Font _defaultFont = ThemeDB.FallbackFont;

public override void _Draw()
{
    Color white = Colors.White;
    Color godotBlue = new Color("478cbf");
    Color grey = new Color("414042");

    DrawPolygon(_head, [godotBlue]);
    DrawPolyline(_mouth, white, _mouthWidth);
    DrawCircle(new Vector2(42.479f, 65.4825f), 9.3905f, white);
    DrawCircle(new Vector2(85.524f, 65.4825f), 9.3905f, white);
    DrawCircle(new Vector2(43.423f, 65.92f), 6.246f, grey);
    DrawCircle(new Vector2(84.626f, 66.008f), 6.246f, grey);
    DrawLine(new Vector2(64.273f, 60.564f), new Vector2(64.273f, 74.349f),
             white, 5.8f);

    // Draw GODOT text below the logo with the default font, size 22.
    DrawString(_defaultFont, new Vector2(20f, 130f), "GODOT",
               HorizontalAlignment.Center, 90, 22);
}
我们这里首先将 defaultFont 变量配置为默认的主题字体(也可以设为自定义字体),然后传入字体、位置、文本、水平对齐、宽度、字体大小等参数。
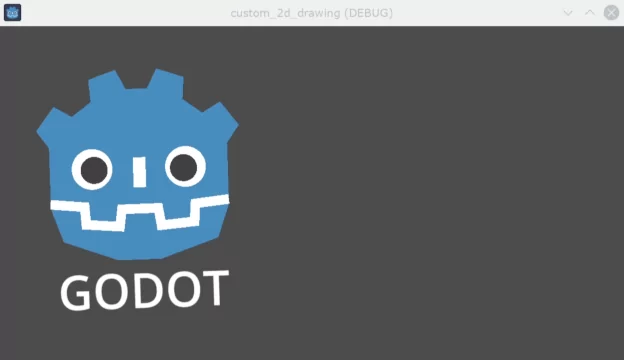
你应当在屏幕上看到如下所示的图像:
其他参数以及其他和文本字符相关的方法都可以在 CanvasItem 的类参考中找到。
编辑时显示绘制
虽然目前这段代码已经可以在运行中的窗口中绘制 Logo,但却并没有在编辑器中的 2D 视图 上显示。在某些特定情况下,你希望自制的 Node2D 或者控件节点能够在编辑器中显示,跟其他绝大多数节点一样,这以便于定位和缩放。
为了能够在编辑器中直接显示 Logo,而不必运行程序,你可以使用 @tool 注解,来要求自制的绘制节点在编辑时显示,就像这样:
@tool
extends Node2D
using Godot;

[Tool]
public partial class MyNode2D : Node2D
每当你添加或移除 @tool 注解时,你需要保存场景,重新构建项目(仅限 C#),并且选择菜单选项 场景 > 重载已保存场景 来手动重载当前场景,才能刷新 2D 视图中的节点。
动画
如果希望自制图形在运行时改变形状,便需要修改执行时调用的方法或者参数,或者应用一个变换。
举个例子,如果想让我们刚刚设计的自制形状旋转,那么可以先 _ready 和 _process 方法中添加如下变量和代码:
extends Node2D

@export var rotation_speed : float = 1  # In radians per second.

func _ready():
    rotation = 0
    ...

func _process(delta: float):
    rotation -= rotation_speed * delta
[Export]
public float RotationSpeed { get; set; } = 1.0f;  // In radians per second.

public override void _Ready()
{
    Rotation = 0;
    ...
}

public override void _Process(double delta)
{
    Rotation -= RotationSpeed * (float)delta;
}
上述代码的问题在于,我们所创建的点是差不多是从左上角,即坐标轴的 (0, 0) 处,扩展到右下角,所以看到的旋转才是以左上角为轴心的。对于节点的位置变换并不能帮到我们,因为旋转变化会先作用。
不过我们可以重写所有点的坐标,使其以 (0, 0) 点为中心,这就包括了坐标的负半轴,那可是个大工程。
一个可行的方案就是使用更底层的 draw_set_transform 方法来解决此问题,这个方法能够平移 CanvasItem 自身空间的所有点,然后再使用常规的节点变换将其移动至原位,用编辑器或代码均可,就像这样:
func _ready():
    rotation = 0
    position = Vector2(60, 60)
    ...

func _draw():
    draw_set_transform(Vector2(-60, -60))
    ...
public override void _Ready()
{
    Rotation = 0;
    Position = new Vector2(60, 60);
    ...
}

public override void _Draw()
{
    DrawSetTransform(new Vector2(-60.0f, -60.0f));
    ...
}
这就是最终结果,以 (60, 60) 点为轴心旋转:
如果我们在 _draw() 中调用属性而动画化,必须调用 queue_redraw() 来强制刷新,否则不会在屏幕上更新内容。
例如,可以通过改变嘴巴线条的宽度,使机器人“张嘴”和“闭嘴”,宽度的变化遵循正弦 (sin) 曲线:
var _mouth_width : float = 4.4
var _max_width : float = 7
var _time : float = 0

func _process(delta : float):
    _time += delta
    _mouth_width = abs(sin(_time) * _max_width)
    queue_redraw()

func _draw():
    ...
    draw_polyline(mouth, white, _mouth_width)
    ...
private float _mouthWidth = 4.4f;
private float _maxWidth = 7f;
private float _time = 0f;

public override void _Process(double delta)
{
    _time += (float)delta;
    _mouthWidth = Mathf.Abs(Mathf.Sin(_time) * _maxWidth);
    QueueRedraw();
}

public override void _Draw()
{
    ...
    DrawPolyline(_mouth, white, _mouthWidth);
    ...
}
当运行时,它看上去会像这样:
请注意, _mouth_width 与任何其他属性一样,都是用户定义的属性。它或任何其他用作绘图参数的属性,都可以使用更标准的高级方法进行动画处理,例如 Tween 或 AnimationPlayer 节点。唯一区别是需要调用 queue_redraw() 应用更改,使内容在屏幕上显示。
示例 2:绘制动态线条
先前示例展示了如何使用自定义形状和动画绘制和修改节点。这种方法具有一些优势,如使用精确坐标和向量进行绘制,而不是位图(在屏幕上缩放时仍然清晰)。在某些情况下,也可以通过组合如 sprites 或 AnimatedSprites 等高级功能与节点来实现类似的效果,这些节点可以加载 SVG 格式资源,并使用 AnimationPlayer 节点。
在其他情况下这种方法不可行,因为我们无法预先知道运行代码后图形的表现形式。本节将介绍如何绘制动态线条,其坐标事先未知,并且会受到用户输入的影响。
在两点之间绘制直线
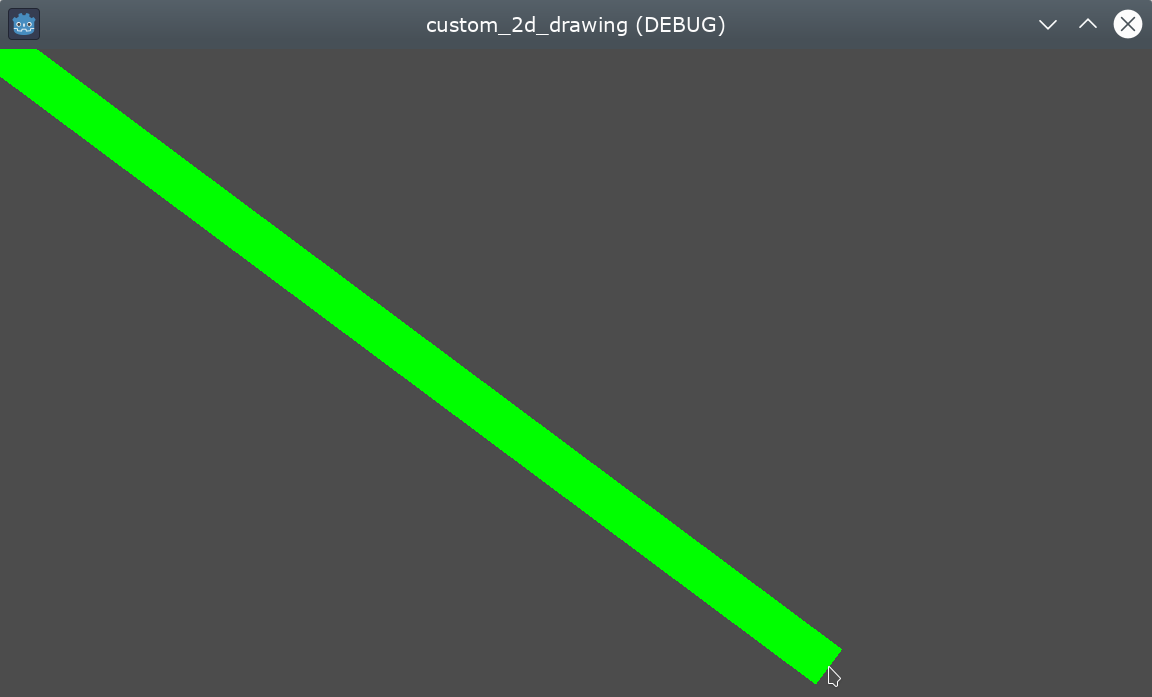
假设我们想要绘制一条连接两个点的直线,第一个点固定在屏幕左上角 (0, 0) ,第二个点由屏幕上的光标位置决定。
可以像这样绘制这两个点之间的动态的线:
extends Node2D

var point1 : Vector2 = Vector2(0, 0)
var width : int = 10
var color : Color = Color.GREEN

var _point2 : Vector2

func _process(_delta):
    var mouse_position = get_viewport().get_mouse_position()
    if mouse_position != _point2:
        _point2 = mouse_position
        queue_redraw()

func _draw():
    draw_line(point1, _point2, color, width)
using Godot;
using System;

public partial class MyNode2DLine : Node2D
{
    public Vector2 Point1 { get; set; } = new Vector2(0f, 0f);
    public int Width { get; set; } = 10;
    public Color Color { get; set; } = Colors.Green;

    private Vector2 _point2;

    public override void _Process(double delta)
    {
        Vector2 mousePosition = GetViewport().GetMousePosition();
        if (mousePosition != _point2)
        {
            _point2 = mousePosition;
            QueueRedraw();
        }
    }

    public override void _Draw()
    {
        DrawLine(Point1, _point2, Color, Width);
    }
}
在这个例子中,我们在每一帧都使用 get_mouse_position 方法获取鼠标在默认视口中的位置。如果位置与上次绘制请求时相比发生了变化(小优化,避免在每一帧都重新绘制),而进行一次重新绘制。_draw() 方法只有一行代码:请求绘制一条绿色线条,宽度为 10 像素,左上角和获取到的坐标之间。
起始点的宽度、颜色和位置可以通过相应的属性进行配置。
运行时,它应当看起来像这样:
绘制两点之间的弧线
上面的例子可以实现效果,但有时可能想用除直线以外的形状或函数连接这两个点。
让我们尝试在两个点之间创建一个弧线(圆周的一部分)。
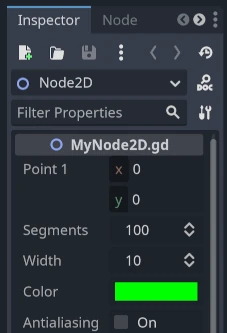
通过将线段的起始点、段数、宽度、颜色和抗锯齿属性导出为变量,从而可在编辑器检查器面板中方便修改这些属性:
extends Node2D

@export var point1 : Vector2 = Vector2(0, 0)
@export_range(1, 1000) var segments : int = 100
@export var width : int = 10
@export var color : Color = Color.GREEN
@export var antialiasing : bool = false

var _point2 : Vector2
using Godot;
using System;

public partial class MyNode2DLine : Node2D
{
    [Export]
    public Vector2 Point1 { get; set; } = new Vector2(0f, 0f);
    [Export]
    public float Length { get; set; } = 350f;
    [Export(PropertyHint.Range, "1,1000,")]
    public int Segments { get; set; } = 100;
    [Export]
    public int Width { get; set; } = 10;
    [Export]
    public Color Color { get; set; } = Colors.Green;
    [Export]
    public bool AntiAliasing { get; set; } = false;

    private Vector2 _point2;
}
为了绘制弧线,可以使用 draw_arc 方法。事实上,穿过两个点的弧线有很多种,在这个例子中,我们将选择一个半圆,它的圆心位于初始两个点之间的中点。
确实,计算此弧线要比计算直线复杂得多:
func _draw():
    # Average points to get center.
    var center : Vector2 = Vector2((_point2.x + point1.x) / 2,
                                   (_point2.y + point1.y) / 2)
    # Calculate the rest of the arc parameters.
    var radius : float = point1.distance_to(_point2) / 2
    var start_angle : float = (_point2 - point1).angle()
    var end_angle : float = (point1 - _point2).angle()
    if end_angle < 0:  # end_angle is likely negative, normalize it.
        end_angle += TAU

    # Finally, draw the arc.
    draw_arc(center, radius, start_angle, end_angle, segments, color,
             width, antialiasing)
public override void _Draw()
{
    // Average points to get center.
    Vector2 center = new Vector2((_point2.X + Point1.X) / 2.0f,
                                    (_point2.Y + Point1.Y) / 2.0f);
    // Calculate the rest of the arc parameters.
    float radius = Point1.DistanceTo(_point2) / 2.0f;
    float startAngle = (_point2 - Point1).Angle();
    float endAngle = (Point1 - _point2).Angle();
    if (endAngle < 0.0f)  // endAngle is likely negative, normalize it.
    {
        endAngle += Mathf.Tau;
    }

    // Finally, draw the arc.
    DrawArc(center, radius, startAngle, endAngle, Segments, Color,
            Width, AntiAliasing);
}
半圆的圆心将是两个点之间的中点。半径将是两个点之间距离的一半。起始角度和结束角度将分别为点 1 到点 2 的向量角度以及点 2 到点 1 的向量角度。需要注意的是,我们需要将 end_angle 归一化为正值,因为如果 end_angle 小于 start_angle ,则弧线将逆时针绘制,在这里,并不想要该效果 (弧线会上下颠倒)。
结果应该像这样,弧线向下延伸并穿过这些点:
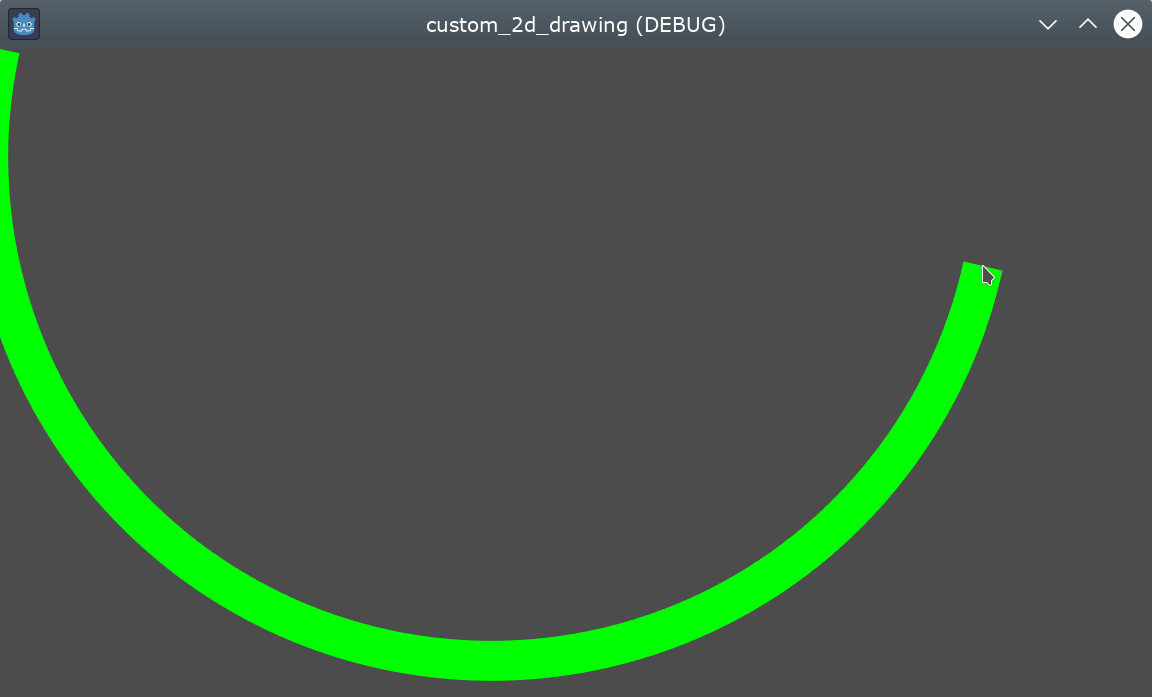
可在检查器中调整参数以获得不同的结果:改变颜色、宽度、抗锯齿,以及增加段数以提高曲线的平滑度,但这样会牺牲部分性能。