自訂效能監控
前言
如 除錯器面板 說明,Godot 提供下方 除錯器 > 效能監控 分頁,可透過圖表追蹤各項數值隨時間變化。這些數據來自引擎的 Performance 單例物件。
自 Godot 4.0 起,你可自訂在效能監控分頁顯示的任意數值。常見用途包括:
顯示專案特有的效能指標。例如體素遊戲可追蹤每秒載入的區塊數量。
記錄與效能無關但有助於除錯的遊戲指標。例如追蹤場上敵人數,檢查敵人產生機制是否正常。
建立自訂效能監控
本範例將建立一個自訂效能監控,追蹤當前專案中的敵人數量。
主場景中有一個 Timer 節點,附加以下腳本:
extends Timer


func _ready():
    # The slash delimiter is used to determine the category of the monitor.
    # If there is no slash in the monitor name, a generic "Custom" category
    # will be used instead.
    Performance.add_custom_monitor("game/enemies", get_enemy_count)
    timeout.connect(_on_timeout)
    # Spawn 20 enemies per second.
    wait_time = 0.05
    start()


func _on_timeout():
    var enemy = preload("res://enemy.tscn").instantiate()
    get_parent().add_child(enemy)


# This function is called every time the performance monitor is queried
# (this occurs once per second in the editor, more if called manually).
# The function must return a number greater than or equal to 0 (int or float).
func get_enemy_count():
    return get_tree().get_nodes_in_group("enemies").size()
Performance.add_custom_monitor 的第二個參數為 Callable。
enemy.tscn 是一個擁有 Node2D 根節點與 Timer 子節點的場景,Node2D 節點附有如下腳本:
extends Node2D


func _ready():
    add_to_group("enemies")
    $Timer.timeout.connect(_on_timer_timeout)
    # Despawn enemies 2.5 seconds after they spawn.
    $Timer.wait_time = 2.5
    $Timer.start()


func _on_timer_timeout():
    queue_free()
本例中,每秒產生 20 名敵人,每名敵人存活 2.5 秒,理論上場景內敵人數將穩定於 50。可透過監控圖表驗證此數值。
要檢視自訂效能監控的圖表,執行專案後切回編輯器,於下方 除錯器 > 效能監控 分頁中,捲動至新出現的 遊戲 分類,勾選 敵人,即可看到如下圖表:
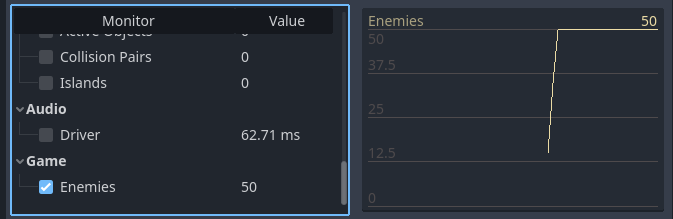
自訂效能監控於編輯器內的圖表示例
備註
效能監控相關程式碼不一定要寫在節點自身腳本內。也可將註冊與取值函式移到 autoload 中集中管理。
於專案中查詢效能監控數值
若你想在遊戲視窗(非編輯器)顯示監控數值,可用 Performance.get_custom_monitor("分類/名稱") 讀取。可用 Label、RichTextLabel、2D 中的自訂繪圖、3D 文字 等方式顯示。
此方法可用於匯出專案(除錯與發行模式),讓你在編輯器外也能顯示自訂效能圖表。