Up to date
This page is up to date for Godot 4.2.
If you still find outdated information, please open an issue.
Panel del depurador
Muchas de las herramientas de depuración de Godot, incluido el depurador, se pueden encontrar en el panel de depuración en la parte inferior de la pantalla. Haz clic en Depurador para abrirlo.
El panel de depuración está dividido en varias pestañas, cada una enfocada en una tarea específica.
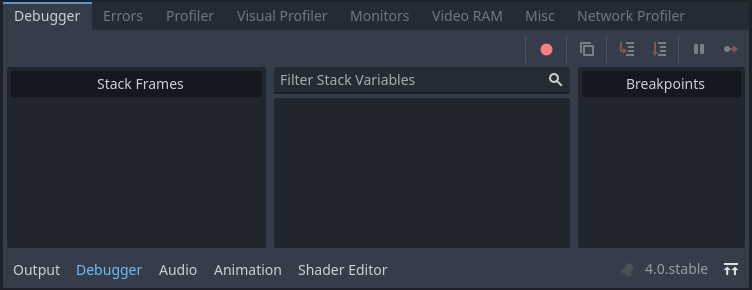
Depurador
La pestaña del depurador se abre automáticamente cuando el compilador de GDScript alcanza un punto de interrupción en tu código.
It gives you a stack trace, information about the state of the object, and buttons to control the program's execution. When the debugger breaks on a breakpoint, a green triangle arrow is visible in the script editor's gutter. This arrow indicates the line of code the debugger broke on.
Truco
You can create a breakpoint by clicking the gutter in the left of the script editor (on the left of the line numbers). When hovering this gutter, you will see a transparent red dot appearing, which turns into an opaque red dot after the breakpoint is placed by clicking. Click the red dot again to remove the breakpoint. Breakpoints created this way persist across editor restarts, even if the script wasn't saved when exiting the editor.
You can also use the breakpoint keyword in GDScript to create a
breakpoint that is stored in the script itself. Unlike breakpoints created by
clicking in the gutter, this keyword-based breakpoint is persistent across
different machines when using version control.
Puedes usar los botones en la esquina superior derecha para:
Saltar todos los puntos de interrupción. De esta manera, puedes guardar los puntos de interrupción para futuras sesiones de depuración.
Copiar el mensaje de error actual.
Entrar en el código. Este botón te lleva a la siguiente línea de código, y si es una función, avanza paso a paso a través de la función línea por línea.
Paso Siguiente en el código. Este botón va a la siguiente línea de código, pero no avanza paso a paso a través de las funciones línea por línea.
Interrumpir. Este botón pausa la ejecución del juego.
Continuar. Este botón reanuda el juego después de un punto de interrupción o pausa.
Errores
Aquí es donde se imprimen los mensajes de error y advertencia mientras el juego se está ejecutando.
Puedes desactivar advertencias (warnings) específicas en Ajustes del Proyecto > Debug > GDScript.
Perfilador
The profiler is used to see what code is running while your project is in use, and how that effects performance.
Ver también
A detailed explanation of how to use the profiler can be found in the dedicated The Profiler page.
Visual Profiler
The Visual Profiler can be used to monitor what is taking the most time when rendering a frame on the CPU and GPU respectively. This allows tracking sources of potential CPU and GPU bottlenecks caused by rendering.
Advertencia
The Visual Profiler only measures CPU time taken for rendering tasks, such as performing draw calls. The Visual Profiler does not include CPU time taken for other tasks such as scripting and physics. Use the standard Profiler tab to track non-rendering-related CPU tasks.
To use the visual profiler, run the project, switch to the Visual Profiler tab within the Debugger bottom panel, then click Start:
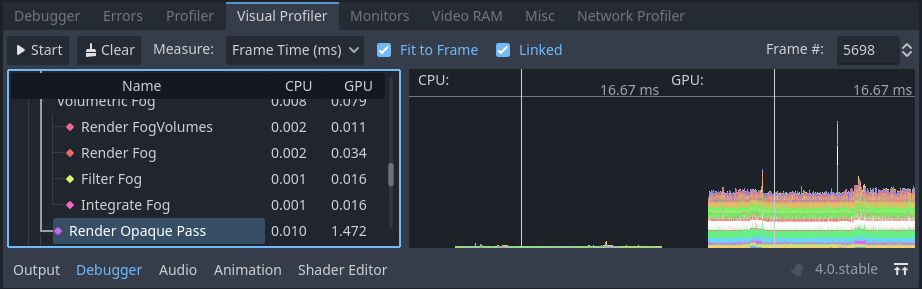
Visual Profiler tab after clicking Start, waiting for a few seconds, then clicking Stop
You will see categories and results appearing as the profiler is running. Graph lines also appear, with the left side being a CPU framegraph and the right side being a GPU framegraph.
Click Stop to finish profiling, which will keep the results visible but frozen in place. Results remain visible after stopping the running project, but not after exiting the editor.
Click on result categories on the left to highlight them in the CPU and GPU graphs on the right. You can also click on the graph to move the cursor to a specific frame number and highlight the selected data type in the result categories on the left.
You can switch the result display between a time value (in milliseconds per frame) or a percentage of the target frametime (which is currently hardcoded to 16.67 milliseconds, or 60 FPS).
If framerate spikes occur during profiling, this can cause the graph to be poorly scaled. Disable Fit to Frame so that the graph will zoom onto the 60 FPS+ portion.
Nota
Remember that Visual Profiler results can vary heavily based on
viewport resolution, which is determined by the window size if using the
disabled or canvas_items stretch modes.
When comparing results across different runs, make sure to use the same viewport size for all runs.
Visual Profiler is supported when using any rendering method (Forward+, Mobile or Compatibility), but the reported categories will vary depending on the current rendering method as well as the enabled graphics features. For example, when using Forward+, a simple 2D scene with shadow-casting lights will result in the following categories appearing:
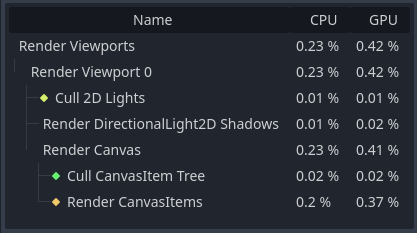
Ejemplo de resultados de una escena 2D en el Perfilador Visual
To give another example with Forward+, a 3D scene with shadow-casting lights and various effects enabled will result in the following categories enabled:
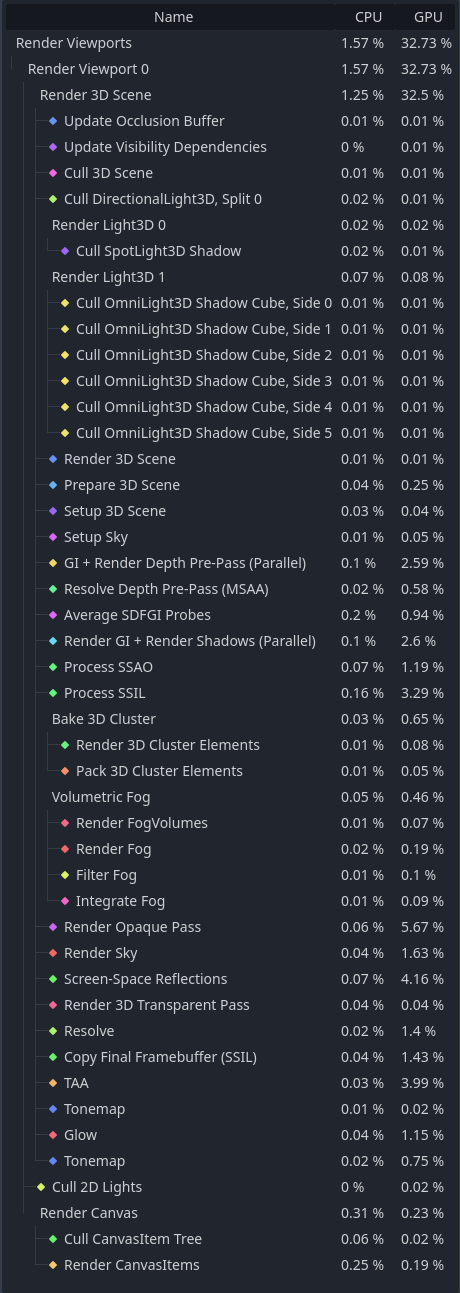
Ejemplo de resultados de una escena 3D en el Perfilador Visual
Notice how in the 3D example, several of the categories have (Parallel) appended to their name. This hints that multiple tasks are being performed in parallel on the GPU. This generally means that disabling only one of the features involved won't improve performance as much as anticipated, as the other task still needs to be performed sequentially.
Profiler de Red
El perfilador de red contiene una lista de todos los nodos que se comunican a través de la API multijugador y, para cada uno, algunos contadores sobre la cantidad de interacciones de red entrantes y salientes. También cuenta con un medidor de ancho de banda que muestra el uso total de ancho de banda en cualquier momento dado.
Nota
The bandwidth meter does not take the Multijugador de alto nivel API's own compression system into account. This means that changing the compression algorithm used will not change the metrics reported by the bandwidth meter.
Monitores
Los monitores son gráficos de varios aspectos del juego mientras se está ejecutando, como FPS (cuadros por segundo), uso de memoria, cantidad de nodos en una escena y más. Todos los monitores registran estadísticas automáticamente, por lo que incluso si un monitor no está abierto mientras el juego se está ejecutando, puedes abrirlo más tarde y ver cómo han cambiado los valores.
Ver también
In addition to the default performance monitors, you can also create custom performance monitors to track arbitrary values in your project.
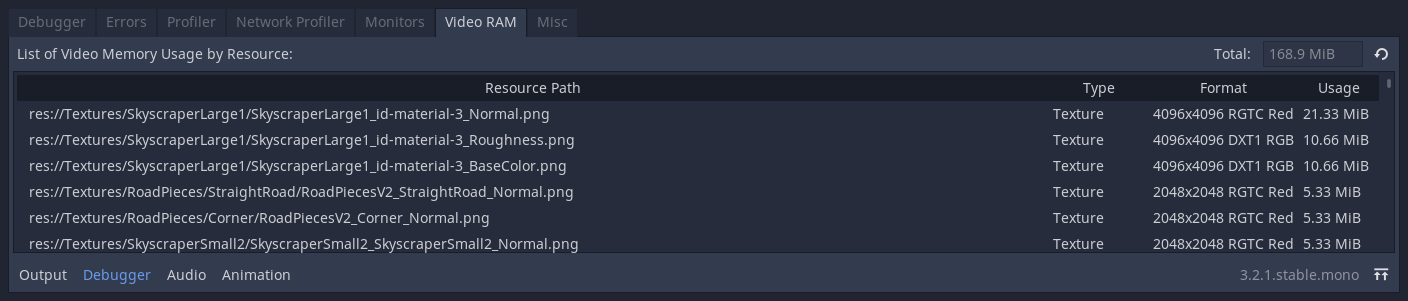
Memoria de Vídeo
La pestaña de Video RAM muestra el uso de la memoria de video (VRAM) del juego mientras se está ejecutando. Proporciona una lista de cada recurso que utiliza VRAM junto con su ruta de recurso, el tipo de recurso que es, el formato en que se encuentra y cuánta VRAM está utilizando ese recurso. También hay un número que muestra el uso total de VRAM en la esquina superior derecha del panel.
Otros
La pestaña de Misc contiene herramientas para identificar los nodos de control en los que haces clic durante la ejecución:
Nodo de Control Clicado te indica dónde se encuentra el nodo en el árbol de escena en el que has hecho clic.
Tipo de Nodo de Control Clicado te indica el tipo del nodo en el que has hecho clic.