Attention: Here be dragons
This is the latest
(unstable) version of this documentation, which may document features
not available in or compatible with released stable versions of Godot.
Checking the stable version of the documentation...
디버거
디버거를 포함한 Godot의 디버깅 도구 중 다수는 화면 하단의 디버거 패널에서 찾을 수 있습니다. **디버거**를 클릭하여 엽니다.
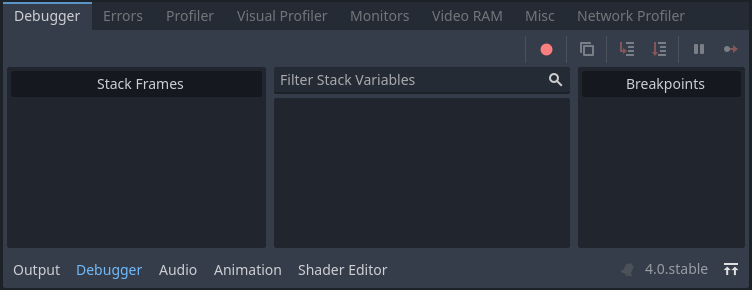
디버거 패널은 여러 탭으로 나누어져 있으며 각 탭은 특정 작업에 중점을 둡니다.
스택 추적
GDScript 컴파일러가 코드에서 중단점에 도달하면 스택 추적 탭이 자동으로 열립니다.
스택 추적, 개체 상태에 대한 정보 및 프로그램 실행을 제어하는 버튼을 제공합니다. 디버거가 중단점에서 중단되면 스크립트 편집기 여백에 녹색 삼각형 화살표가 표시됩니다. 이 화살표는 디버거가 중단된 코드 줄을 나타냅니다.
팁
스크립트 편집기 왼쪽(줄 번호 왼쪽)에 있는 여백을 클릭하여 중단점을 만들 수 있습니다. 이 배수구에 마우스를 올리면 투명한 빨간색 점이 나타나는 것을 볼 수 있으며, 클릭하여 중단점이 배치되면 불투명한 빨간색 점으로 변합니다. 중단점을 제거하려면 빨간색 점을 다시 클릭하세요. 이런 방식으로 생성된 중단점은 편집기를 종료할 때 스크립트가 저장되지 않은 경우에도 편집기를 다시 시작해도 지속됩니다.
GDScript에서 breakpoint 키워드를 사용하여 스크립트 자체에 저장되는 중단점을 만들 수도 있습니다. 여백을 클릭하여 생성된 중단점과 달리 이 키워드 기반 중단점은 버전 제어를 사용할 때 여러 컴퓨터에서 지속됩니다.
오른쪽 상단 모서리에 있는 버튼을 사용하여 다음을 수행할 수 있습니다.
모든 중단점을 건너뜁니다. 이렇게 하면 향후 디버깅 세션을 위해 중단점을 저장할 수 있습니다.
현재 오류 메시지를 복사합니다.
한 단계씩 코드를 살펴보세요. 이 버튼을 누르면 다음 코드 줄로 이동하며, 함수인 경우 함수를 한 줄씩 진행합니다.
코드를 건너뛰세요. 이 버튼은 코드의 다음 줄로 이동하지만 기능을 한 줄씩 실행하지는 않습니다.
휴식. 이 버튼은 게임 실행을 일시 중지합니다.
계속. 이 버튼은 중단점이나 일시 정지 후에 게임을 다시 시작합니다.
참고
tool 스크립트 <doc_running_code_in_the_editor>`에서 디버거 및 중단점 사용은 현재 지원되지 않습니다. 스크립트 편집기에 배치되거나 ``breakpoint` 키워드를 사용하는 중단점은 무시됩니다. 대신 print 문을 사용하여 변수의 내용을 표시할 수 있습니다.
오류
게임 실행 중 오류 및 경고 메시지가 출력되는 곳입니다.
프로젝트 설정에서 GDScript라고 하는 섹션에서 경고를 구성할 수 있습니다:
평가자
이 탭에는 :abbr:`REPL(Read-Eval-Print Loop)`이라고도 하는 식 평가기가 포함되어 있습니다. 이는 스택 추적 탭에서 사용할 수 있는 스택 변수 트리를 더욱 강력하게 보완합니다.
디버거에서 프로젝트가 중단되면(중단점 또는 스크립트 오류로 인해) 상단의 텍스트 필드에 표현식을 입력할 수 있습니다. 프로젝트가 실행 중인 경우 표현식 필드를 편집할 수 없으므로 먼저 중단점을 설정해야 합니다. **실행 시 지우기**를 선택 취소하여 실행 전반에 걸쳐 표현식을 유지할 수 있지만, 편집기가 종료되면 표현식이 손실됩니다.
표현식은 연산을 수행하고 표현식 내에서 일부 함수를 호출할 수 있게 해주는 :ref:`Godot의 표현식 언어 <doc_evaluating_expressions>`를 사용하여 평가됩니다. 식은 중단점이 있는 줄과 동일한 범위 내의 멤버 변수 또는 지역 변수를 참조할 수 있습니다. 또한 상수 값을 입력하여 내장 계산기로 사용할 수도 있습니다.
다음을 명심하세요:
var counter = 0

func _process(delta):
    counter += 1
    if counter == 5:
        var text = "Some text"
        breakpoint
    elif counter >= 6:
        var other_text = "Some other text"
        breakpoint
``breakpoint``가 포함된 첫 번째 줄에서 디버거가 중단되면 다음 식은 null이 아닌 값을 반환합니다.
상수 표현:
2 * PI + 5멤버 변수:
counter,counter ** 2,sqrt(counter)로컬 변수 또는 함수 매개변수:
delta,text,text.to_upper()
``breakpoint``가 포함된 두 번째 줄에서 디버거가 중단되면 다음 식은 null이 아닌 값을 반환합니다.
상수 표현:
2 * PI + 5멤버 변수:
counter,counter ** 2,sqrt(counter)로컬 변수 또는 함수 매개변수:
delta,other_text,other_text.to_upper()
프로파일러
프로파일러는 프로젝트가 사용 중인 동안 어떤 코드가 실행되고 있는지, 그리고 이것이 성능에 어떤 영향을 미치는지 확인하는 데 사용됩니다.
더 보기
프로파일러 사용 방법에 대한 자세한 설명은 전용 프로파일러 페이지에서 확인할 수 있습니다.
프로파일러
Visual Profiler를 사용하면 CPU와 GPU에서 각각 프레임을 렌더링할 때 가장 많은 시간이 걸리는 부분을 모니터링할 수 있습니다. 이를 통해 렌더링으로 인해 발생할 수 있는 CPU 및 GPU 병목 현상의 원인을 추적할 수 있습니다.
경고
비주얼 프로파일러는 그리기 호출 수행과 같은 렌더링 작업에 소요된 CPU 시간만 측정합니다. Visual Profiler에는 스크립팅 및 물리와 같은 다른 작업에 소요된 CPU 시간이 포함되지 않습니다. 렌더링과 관련되지 않은 CPU 작업을 추적하려면 표준 프로파일러 탭을 사용하세요.
시각적 프로파일러를 사용하려면 프로젝트를 실행하고 디버거 하단 패널 내 비주얼 프로파일러 탭으로 전환한 다음 **시작**을 클릭하세요.
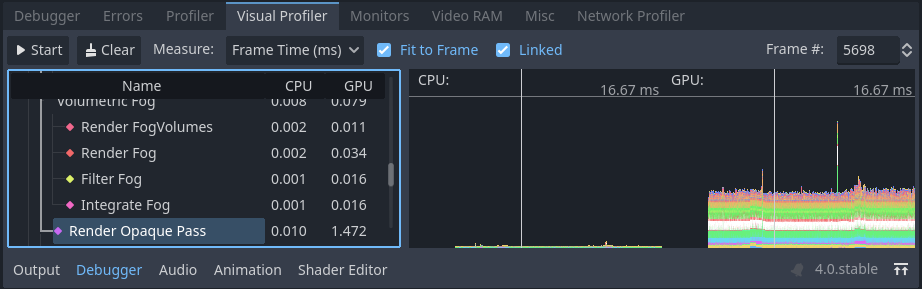
**시작**을 클릭하고 몇 초 동안 기다린 다음 **중지**를 클릭한 후의 Visual Profiler 탭
팁
다음에 프로젝트가 실행될 때 비주얼 프로파일러가 자동으로 시작되도록 자동 시작**을 선택할 수도 있습니다. **Autostart 체크박스의 상태는 에디터 세션 전반에 걸쳐 유지되지 않습니다.
프로파일러가 실행되는 동안 카테고리와 결과가 표시됩니다. 그래프 선도 나타나며 왼쪽은 CPU 프레임그래프이고 오른쪽은 GPU 프레임그래프입니다.
프로파일링을 마치려면 **중지**를 클릭하세요. 결과는 계속 표시되지만 제자리에 고정됩니다. 실행 중인 프로젝트를 중지한 후에도 결과는 계속 표시되지만 편집기를 종료한 후에는 표시되지 않습니다.
왼쪽의 결과 범주를 클릭하면 오른쪽의 CPU 및 GPU 그래프에서 해당 범주가 강조 표시됩니다. 그래프를 클릭하여 커서를 특정 프레임 번호로 이동하고 왼쪽의 결과 범주에서 선택한 데이터 유형을 강조 표시할 수도 있습니다.
You can switch the result display between a time value (in milliseconds per frame) or a percentage of the target frametime. The debugger/profiler_target_fps editor setting controls the target frametime value according to the specified FPS.
프로파일링 중에 프레임 속도 스파이크가 발생하면 그래프의 크기가 잘못 조정될 수 있습니다. 그래프가 60FPS+ 부분으로 확대되도록 **프레임에 맞춤**을 비활성화합니다.
참고
Visual Profiler 결과는 disabled 또는 canvas_items :ref:`stretch mode <doc_multiple_solutions>`을 사용하는 경우 창 크기에 따라 결정되는 뷰포트 해상도에 따라 크게 달라질 수 있습니다.
여러 실행에서 결과를 비교할 때 모든 실행에 동일한 뷰포트 크기를 사용해야 합니다.
Visual Profiler는 모든 렌더링 방법(Forward+, 모바일 또는 호환성)을 사용할 때 지원되지만 보고된 범주는 현재 렌더링 방법과 활성화된 그래픽 기능에 따라 달라집니다. 예를 들어 Forward+를 사용할 때 그림자 투사 조명이 포함된 간단한 2D 씬을 사용하면 다음 범주가 나타납니다.
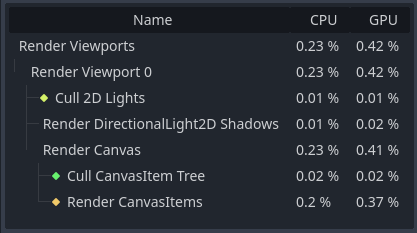
비주얼 프로파일러의 2D 씬 결과 예
Forward+의 또 다른 예를 들자면 그림자 투사 조명과 다양한 효과가 활성화된 3D 씬는 다음 범주를 활성화합니다.
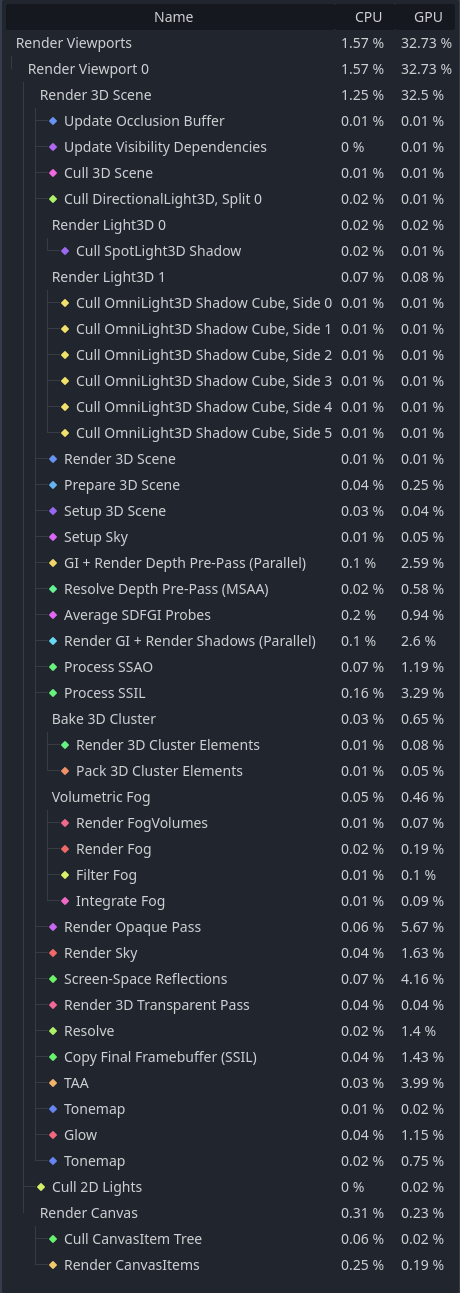
비주얼 프로파일러의 3D 씬 결과 예
3D 예에서 여러 카테고리의 이름에 **(평행)**이 추가된 것을 확인하세요. 이는 GPU에서 여러 작업이 병렬로 수행되고 있음을 암시합니다. 이는 일반적으로 관련된 기능 중 하나만 비활성화해도 다른 작업을 순차적으로 수행해야 하므로 예상만큼 성능이 향상되지 않는다는 것을 의미합니다.
참고
플랫폼 제한으로 인해 macOS에서 호환성 렌더러를 사용하는 경우 비주얼 프로파일러가 지원되지 않습니다.
네트워크 프로파일러
네트워크 프로파일러에는 멀티플레이어 API를 통해 통신하는 모든 노드 목록과 각각에 대해 들어오고 나가는 네트워크 상호 작용의 양에 대한 일부 카운터가 포함되어 있습니다. 또한 특정 순간의 총 대역폭 사용량을 표시하는 대역폭 미터 기능도 있습니다.
참고
대역폭 측정기는 고수준 멀티플레이어 API의 자체 압축 시스템을 고려하지 않습니다. 이는 사용된 압축 알고리즘을 변경해도 대역폭 측정기에 의해 보고된 메트릭이 변경되지 않음을 의미합니다.
모니터
모니터는 FPS, 메모리 사용량, 씬에 있는 노드 수 등 게임이 실행되는 동안의 여러 측면에 대한 그래프입니다. 모든 모니터는 자동으로 통계를 추적하므로 게임이 실행되는 동안 하나의 모니터가 열려 있지 않더라도 나중에 열어서 값이 어떻게 변경되었는지 확인할 수 있습니다.
더 보기
기본 성능 모니터 외에도 :ref:`사용자 정의 성능 모니터 <doc_custom_performance_monitors>`를 생성하여 프로젝트의 임의 값을 추적할 수도 있습니다.
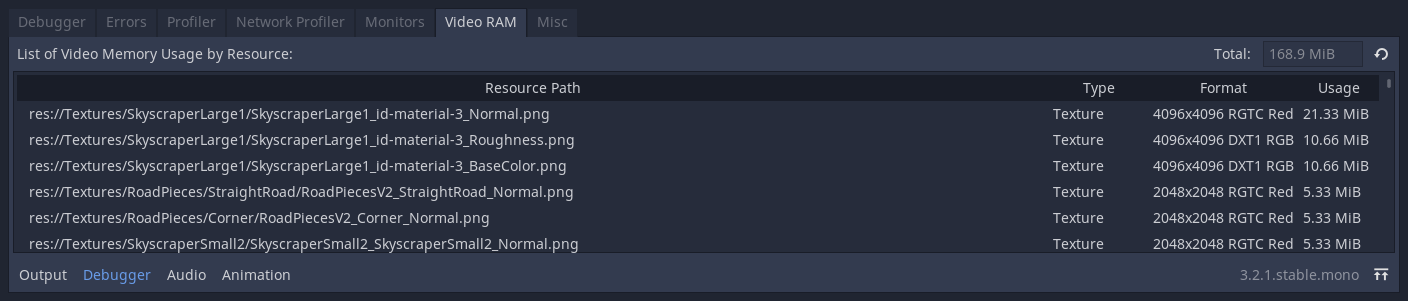
비디오 RAM
비디오 RAM 탭에는 게임이 실행되는 동안 게임의 비디오 RAM 사용량이 표시됩니다. 리소스 경로별로 비디오 RAM을 사용하는 모든 리소스 목록, 리소스 유형, 형식, 해당 리소스가 사용 중인 비디오 RAM 양을 제공합니다. 패널 오른쪽 상단에는 총 비디오 RAM 사용량도 표시됩니다.
기타
기타 탭에는 런타임 시 클릭하는 컨트롤 노드를 식별하는 도구가 포함되어 있습니다.