Attention: Here be dragons
This is the latest
(unstable) version of this documentation, which may document features
not available in or compatible with released stable versions of Godot.
Checking the stable version of the documentation...
디버깅 도구 개요
이 가이드에서는 엔진에서 사용할 수 있는 디버깅 도구에 대한 개요를 제공합니다.
Godot에는 버그를 추적하고, 런타임에 게임을 검사하고, 필수 지표를 모니터링하고, 성능을 측정할 수 있는 강력한 디버거와 프로파일러가 함께 제공됩니다. 또한 실행 중인 게임에서 충돌 상자와 탐색 다각형을 시각화하는 옵션도 제공합니다.
마지막으로 원격 장치에서 실행 중인 게임을 디버깅하고 게임이 실행되는 동안 장면이나 코드에 대한 변경 사항을 다시 로드할 수 있는 옵션이 있습니다.
출력 로그
출력 패널을 사용하면 프로젝트뿐만 아니라 편집기(예: @tool 스크립트)에서 인쇄된 텍스트를 볼 수 있습니다. :ref:`doc_output_panel`에서 정보를 찾을 수 있습니다.
디버거
Godot의 디버깅 도구 중 다수는 :ref:`doc_debugger_panel`에서 정보를 찾을 수 있는 디버거 패널의 일부입니다.
디버그 메뉴 옵션
편집기에서 게임을 실행할 때 켜거나 끌 수 있는 몇 가지 일반적인 디버그 옵션이 있으며, 이는 게임 디버깅에 도움이 될 수 있습니다.
디버그 편집기 메뉴에서 이러한 옵션을 찾을 수 있습니다.
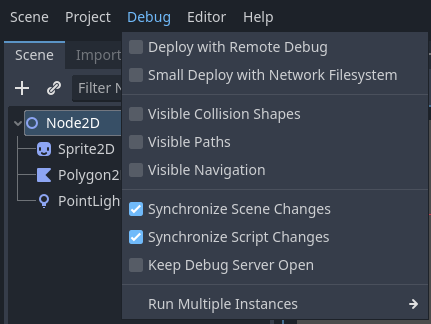
옵션에 대한 설명은 다음과 같습니다.
원격 디버그와 함께 배포
이 옵션이 활성화된 경우 원클릭 배포를 사용하면 실행 파일이 이 컴퓨터의 IP에 연결을 시도하여 실행 중인 프로젝트를 디버깅할 수 있습니다. 이 옵션은 원격 디버깅(일반적으로 모바일 장치 사용)에 사용하기 위한 것입니다. GDScript 디버거를 로컬에서 사용하기 위해 이를 활성화할 필요는 없습니다.
네트워크 파일시스템으로 작게 배포
이 옵션을 사용하면 원격 장치에서 차지하는 공간이 큰 게임에 대한 테스트 속도가 빨라집니다.
**네트워크 파일 시스템을 사용한 소규모 배포**가 켜져 있으면 전체 게임을 내보내는 대신 게임을 배포하면 최소한의 실행 파일이 빌드됩니다. 그런 다음 편집기는 네트워크를 통해 프로젝트의 파일을 제공합니다.
또한 Android에서는 배포 속도를 높이기 위해 USB 케이블을 사용하여 게임을 배포합니다.
보여줄 콜리전 모양
이 옵션이 활성화되면 충돌 모양과 레이캐스트 노드(2D 및 3D용)가 실행 중인 프로젝트에 표시됩니다.
보여줄 경로
이 옵션이 활성화되면 노드 경로에서 사용되는 곡선 리소스가 실행 중인 프로젝트에 표시됩니다.
보여줄 어보이던스
이 옵션이 활성화되면 회피 객체 모양, 반경 및 속도가 실행 중인 프로젝트에 표시됩니다.
CanvasItem 리드로우를 디버깅
이 옵션이 활성화되면 2D 개체의 다시 그리기 요청이 실행 중인 프로젝트에서 (짧은 깜박임으로) 표시됩니다. 이는 낮은 프로세서 모드 문제를 해결하는 데 유용합니다.
씬 변경사항 동기화
이 옵션이 활성화되면 편집기에서 씬에 대한 모든 변경 사항이 실행 중인 프로젝트에 복제됩니다. 장치에서 원격으로 사용하는 경우 네트워크 파일 시스템 옵션이 활성화되어 있으면 더 효율적입니다.
스크립트 변경사항 동기화
이 옵션이 활성화되면 편집기에서 스크립트에 대한 모든 변경 사항이 실행 중인 프로젝트에 다시 로드됩니다. 장치에서 원격으로 사용하면 네트워크 파일 시스템을 사용하는 것이 더 효율적입니다.
디버그 서버를 열어두세요
이 옵션이 활성화되면 에디터 디버그 서버는 열린 상태로 유지되며 에디터 자체 외부에서 시작된 새 세션을 수신합니다.
실행 인스턴스 사용자 정의...
그러면 Godot에게 게임의 여러 인스턴스를 동시에 실행하고 각 인스턴스에 대한 명령줄 인수를 지정하도록 지시할 수 있는 대화 상자가 열립니다. 이는 멀티플레이어 게임을 빌드하고 디버깅할 때 특히 유용합니다.

다중 인스턴스 활성화
이 옵션이 활성화되면 프로젝트를 실행할 때 편집기가 프로젝트의 여러 인스턴스를 동시에 실행합니다.
이 확인란 아래에는 실행할 인스턴스 수를 선택하는 선택기가 있습니다.
확인란을 선택하고 1로만 설정하는 것은 이 확인란을 전혀 선택하지 않는 것과 같습니다.
기본 실행 인수
특정 인스턴스에 대해 "기본 실행 인수 재정의"에서 "활성화"를 선택하지 않는 한 프로젝트를 실행할 때 프로젝트의 모든 인스턴스에 전달되는 인수입니다.
이러한 인수는 공백으로 구분됩니다.
팁
이러한 인수는 :ref:`get_cmdline_args<class_OS_method_get_cmdline_args>`를 사용하여 스크립트에서 액세스할 수 있습니다.
경고
"다중 인스턴스 활성화"를 선택 취소하더라도 프로젝트를 실행할 때 이러한 인수가 전달됩니다.
기본 실행 인수 재정의
이 기능이 활성화되면 프로젝트를 실행할 때 "Main Run Args" 필드의 인수가 프로젝트의 이 특정 인스턴스에 전달되지 않습니다.
함수 인수로:
이는 프로젝트를 실행할 때 프로젝트의 특정 인스턴스에 전달되는 인수입니다. "기본 실행 인수 재정의"에서 "활성화"를 선택하지 않는 한 "기본 실행 인수"와 **결합**됩니다.
스크립트 편집기 디버그 도구 및 옵션
스크립트 편집기에는 중단점 및 두 가지 옵션과 함께 사용할 수 있는 자체 디버그 도구 세트가 있습니다. 중단점 도구는 디버거의 디버거 탭에서도 찾을 수 있습니다.
팁
스크립트 편집기 왼쪽(줄 번호 왼쪽)에 있는 여백을 클릭하여 중단점을 만들 수 있습니다. 이 배수구에 마우스를 올리면 투명한 빨간색 점이 나타나는 것을 볼 수 있으며, 클릭하여 중단점이 배치되면 불투명한 빨간색 점으로 변합니다. 중단점을 제거하려면 빨간색 점을 다시 클릭하세요. 이런 방식으로 생성된 중단점은 편집기를 종료할 때 스크립트가 저장되지 않은 경우에도 편집기를 다시 시작해도 지속됩니다.
GDScript에서 breakpoint 키워드를 사용하여 스크립트 자체에 저장되는 중단점을 만들 수도 있습니다. 여백을 클릭하여 생성된 중단점과 달리 이 키워드 기반 중단점은 버전 제어를 사용할 때 여러 컴퓨터에서 지속됩니다.
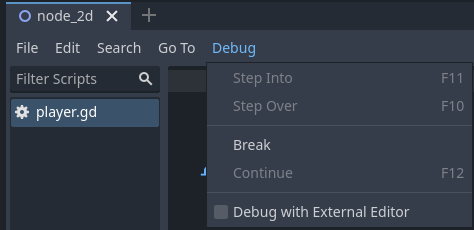
Break 버튼은 중단점처럼 스크립트를 중단시킵니다. **계속**은 중단점에서 일시 중지된 후 게임을 계속합니다. **Step Over**는 코드의 다음 줄로 이동하고, **Step Into**는 가능하면 함수로 들어갑니다. 그렇지 않으면 **Step Over**와 동일한 작업을 수행합니다.
외부 편집기로 디버그 옵션을 사용하면 외부 편집기로 게임을 디버그할 수 있습니다. **에디터 설정 > 단축키 > 디버거**에서 단축키를 설정할 수 있습니다.
디버거가 중단점에서 중단되면 스크립트 편집기 여백에 녹색 삼각형 화살표가 표시됩니다. 이 화살표는 디버거가 중단된 코드 줄을 나타냅니다.
프로젝트 설정 재정의하기
프로젝트 설정에는 다양한 항목을 제어하는 하위 범주가 있는 디버그 범주가 있습니다. 이 설정을 변경하려면 **고급 설정**을 활성화하세요.
설정
이는 현재 FPS를 출력 패널에 인쇄하는 것과 같은 일부 일반 설정, 프로파일링 시 최대 기능 수 등입니다.
디버깅
이러한 설정을 사용하면 콘솔 출력 및 오류 메시지를 파일에 기록할 수 있습니다.
GDScript
이러한 설정을 사용하면 사용되지 않는 변수와 같은 특정 GDScript 경고를 전환할 수 있습니다. 경고를 완전히 끌 수도 있습니다. 자세한 내용은 :ref:`doc_gdscript_warning_system`를 참조하세요.
디자인 언어
이러한 설정을 사용하면 사용되지 않는 변수와 같은 특정 셰이더 경고를 전환할 수 있습니다. 경고를 완전히 끌 수도 있습니다.
캔버스 변형
이러한 설정은 캔버스 항목 다시 그리기 디버깅을 위한 것입니다.
모양
모양은 충돌 및 탐색 모양과 같이 디버깅 목적으로만 나타나는 모양의 색상을 조정할 수 있는 곳입니다.
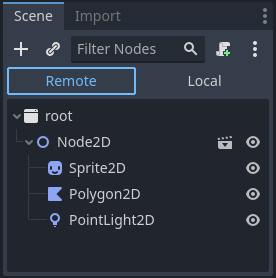
씬 도크의 원격
편집기에서 게임을 실행할 때 씬 도크 상단에 원격 및 **로컬**이라는 두 가지 옵션이 나타납니다. **원격**을 사용하는 동안 실행 중인 프로젝트에서 노드' 매개변수를 검사하거나 변경할 수 있습니다.
참고
디버깅과 관련된 일부 에디터 설정은 에디터 설정, 네트워크 > 디버그 및 디버거 섹션에서 찾을 수 있습니다.