Overview of debugging tools
Introduction
When developing your game, you would want to test your game and debug when problems occurred. Godot provides several debugging options and tools which aid your debugging process.
Debug options
There are a few options that you can enable when running your game in the editor which can help you in debugging your game.
These options are located in DEBUG in the main menus.
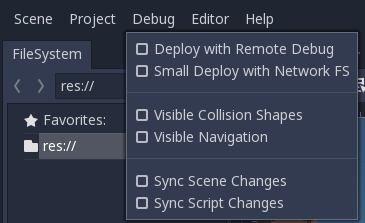
Here are the descriptions of the options:
Deploy with Remote Debug
When exporting and deploying, the resulting executable will attempt to connect to the IP of your computer, in order to be debugged.
Small Deploy with Network FS
Export or deploy will produce minimal executable. The filesystem will be provided from the project by the editor over the network. On Android, deploy will use the USB cable for faster performance. This option speeds up testing for games with a large footprint.
Visible Collision Shapes
Collision shapes and raycast nodes(for 2D and 3D) will be visible on the running game.
Sync Scene Changes
Any changes made to the scene in the editor will be replicated in the running game. When used remotely on a device, this is more efficient with network filesystem.
Sync Script Changes
Any script that is saved will be reloaded on the running game. When used remotely on a device, this is more efficient with network filesystem.
Debugging tools
The Debugger is the second option in the bottom panel. Click on it and a new panel occurs.
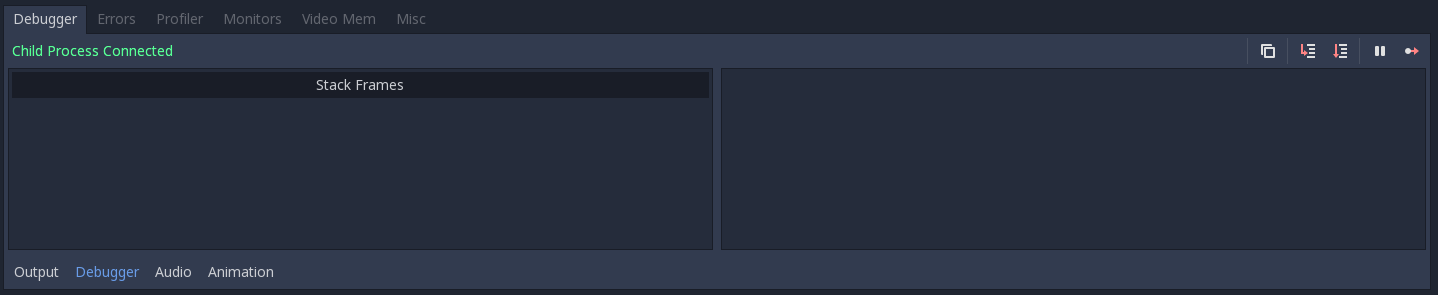
The Debugger provides certain tools under different tabs.
Here are some brief descriptions of the tools:
Debugger
Monitor the game running process.
Errors
Print out errors when running the game.
Profiler
Profiling the performance of the any function call in the running game.
Monitors
Monitors the performance of the running game, such as the fps and physics collisions.
Video Mem
Listing the video memory usage of the running game.
Misc
Miscellaneous options for debug.
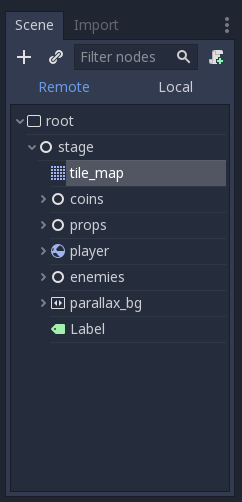
Remote in Scene dock
When running your game, a bar will occur at the top of the Scene dock. You can switch to Remote and inspect or change the nodes’ parameters in the running game.
Note
Some editor settings related to debugging can be found inside the Editor Settings, under Network>Debug and Debugger sections.