Up to date
This page is up to date for Godot 4.2.
If you still find outdated information, please open an issue.
调试器面板
在屏幕下方的调试器面板中, 可以找到包括调试器在内的许多Godot的调试工具. 点击 调试器 即可打开.
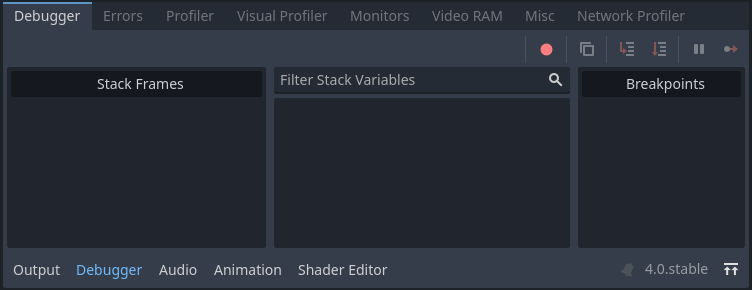
调试器面板被分成几个标签, 每个标签专注于一个特定的任务.
调试器
当 GDScript 编译器在你的代码中达到一个断点时,“调试器”选项卡会自动打开。
It gives you a stack trace, information about the state of the object, and buttons to control the program's execution. When the debugger breaks on a breakpoint, a green triangle arrow is visible in the script editor's gutter. This arrow indicates the line of code the debugger broke on.
小技巧
You can create a breakpoint by clicking the gutter in the left of the script editor (on the left of the line numbers). When hovering this gutter, you will see a transparent red dot appearing, which turns into an opaque red dot after the breakpoint is placed by clicking. Click the red dot again to remove the breakpoint. Breakpoints created this way persist across editor restarts, even if the script wasn't saved when exiting the editor.
You can also use the breakpoint keyword in GDScript to create a
breakpoint that is stored in the script itself. Unlike breakpoints created by
clicking in the gutter, this keyword-based breakpoint is persistent across
different machines when using version control.
你可以使用右上角的按钮来:
跳过所有断点. 这样一来, 你就可以为将来的调试会话保存断点.
复制当前错误消息.
步入 代码. 这个按钮将带你进入下一行代码, 如果是函数, 它将逐行进入函数.
步过 的代码. 这个按钮会进入下一行代码, 但它不会逐行跳过函数.
Break . 这个按钮会暂停执行游戏.
继续 . 该按钮在断点或暂停后恢复游戏.
错误
这是运行游戏时打印错误和警告信息的地方.
你可以在 项目设置>调试> GDScript 中禁用特定的警告.
分析器
The profiler is used to see what code is running while your project is in use, and how that effects performance.
参见
A detailed explanation of how to use the profiler can be found in the dedicated 性能分析器 page.
Visual Profiler
The Visual Profiler can be used to monitor what is taking the most time when rendering a frame on the CPU and GPU respectively. This allows tracking sources of potential CPU and GPU bottlenecks caused by rendering.
警告
The Visual Profiler only measures CPU time taken for rendering tasks, such as performing draw calls. The Visual Profiler does not include CPU time taken for other tasks such as scripting and physics. Use the standard Profiler tab to track non-rendering-related CPU tasks.
To use the visual profiler, run the project, switch to the Visual Profiler tab within the Debugger bottom panel, then click Start:
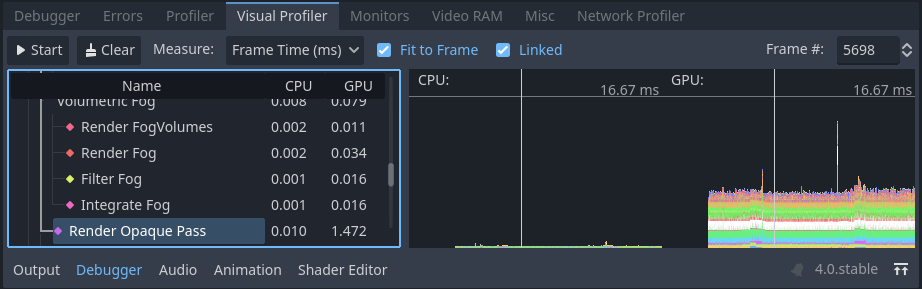
Visual Profiler tab after clicking Start, waiting for a few seconds, then clicking Stop
You will see categories and results appearing as the profiler is running. Graph lines also appear, with the left side being a CPU framegraph and the right side being a GPU framegraph.
Click Stop to finish profiling, which will keep the results visible but frozen in place. Results remain visible after stopping the running project, but not after exiting the editor.
Click on result categories on the left to highlight them in the CPU and GPU graphs on the right. You can also click on the graph to move the cursor to a specific frame number and highlight the selected data type in the result categories on the left.
You can switch the result display between a time value (in milliseconds per frame) or a percentage of the target frametime (which is currently hardcoded to 16.67 milliseconds, or 60 FPS).
If framerate spikes occur during profiling, this can cause the graph to be poorly scaled. Disable Fit to Frame so that the graph will zoom onto the 60 FPS+ portion.
备注
Remember that Visual Profiler results can vary heavily based on
viewport resolution, which is determined by the window size if using the
disabled or canvas_items stretch modes.
When comparing results across different runs, make sure to use the same viewport size for all runs.
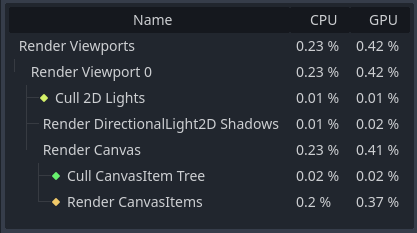
Visual Profiler is supported when using any rendering method (Forward+, Mobile or Compatibility), but the reported categories will vary depending on the current rendering method as well as the enabled graphics features. For example, when using Forward+, a simple 2D scene with shadow-casting lights will result in the following categories appearing:
例子结果来自Callgrind, 这是Valgrind的一部分
To give another example with Forward+, a 3D scene with shadow-casting lights and various effects enabled will result in the following categories enabled:
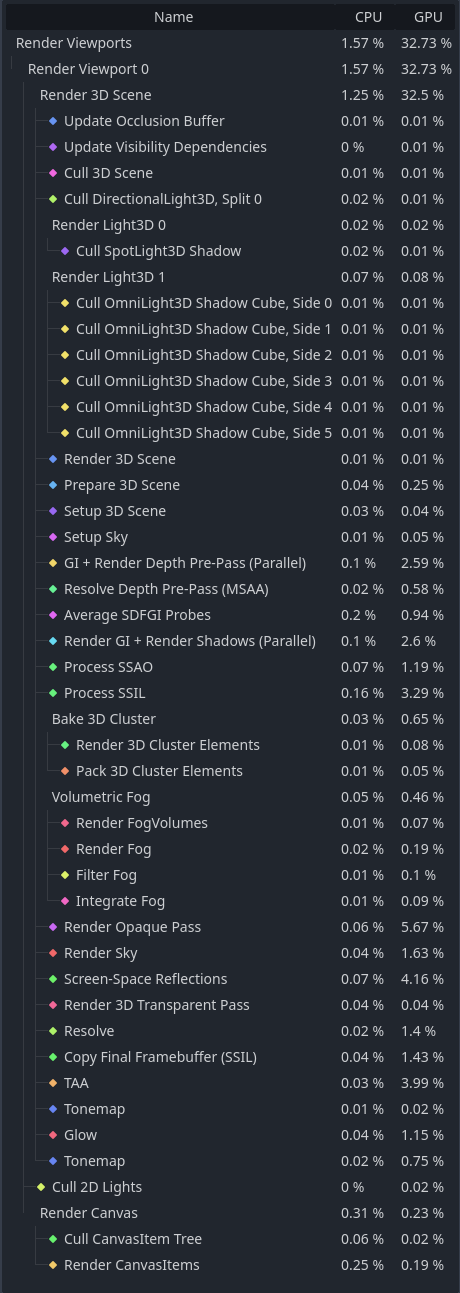
可视分析器中 3D 场景的示例结果
Notice how in the 3D example, several of the categories have (Parallel) appended to their name. This hints that multiple tasks are being performed in parallel on the GPU. This generally means that disabling only one of the features involved won't improve performance as much as anticipated, as the other task still needs to be performed sequentially.
网络分析器
网络剖析器包含了所有通过多人游戏API进行通信的节点列表, 对于每个节点, 还包含了一些传入和传出网络交互量的计数器. 它还具有一个带宽表, 可以显示任何特定时刻的总带宽使用情况.
备注
The bandwidth meter does not take the 高级多人游戏 API's own compression system into account. This means that changing the compression algorithm used will not change the metrics reported by the bandwidth meter.
监视
监视器是游戏运行时几个方面的图表, 如FPS, 内存使用情况, 场景中的节点数量等等. 所有的监控器都会自动跟踪统计, 所以即使游戏运行时一个监控器没有打开, 你也可以在以后打开它, 查看数值的变化.
参见
In addition to the default performance monitors, you can also create custom performance monitors to track arbitrary values in your project.
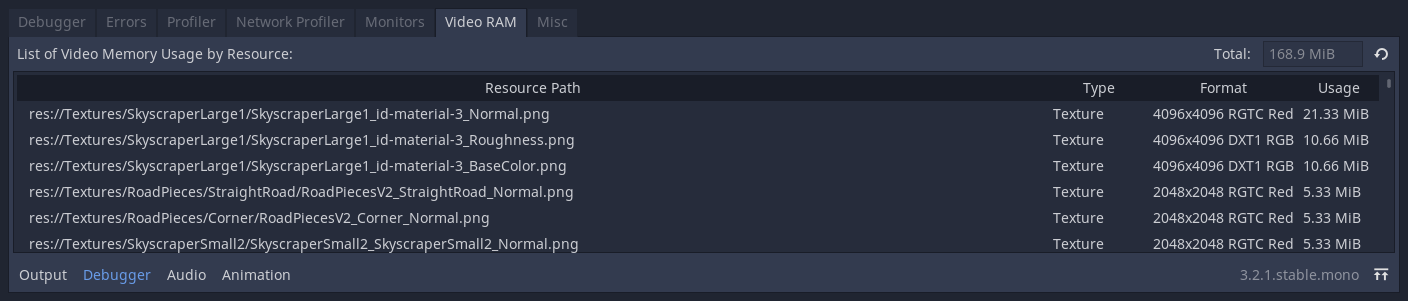
显存
显存标签显示了游戏运行时的显存使用情况。它按资源路径提供了每一个使用显存的资源列表、资源的类型、资源的格式,以及该资源使用了多少显存。在面板的右上方还有一个显存占用总量的数字。
其他
其他选项卡中的工具可以用来识别你在运行时点击了哪个控件节点:
点击的控件显示的是被点击节点在场景树中的位置。
点击的控件类型显示的是被点击节点的类型。