Up to date
This page is up to date for Godot 4.2.
If you still find outdated information, please open an issue.
调试工具概述
本指南将概述引擎中可用的调试工具.
Godot自带强大的调试器和剖析器, 可以追踪bug, 在运行时检查你的游戏, 监控重要指标, 并测量性能. 它还提供了在运行游戏中可视化碰撞框和导航多边形的选项.
最后, 你可以选择调试在远程设备上运行的游戏, 并在游戏运行时重新加载对你的场景或代码的修改.
调试器面板
Godot 的许多调试工具都是“调试器”面板的一部分,你可以在 调试器面板 中找到相关信息。
调试菜单选项
在编辑器中运行游戏时, 有几个常见的调试选项可以切换为开或关, 以帮助你调试游戏.
你可以在编辑器菜单调试中找到这些选项。
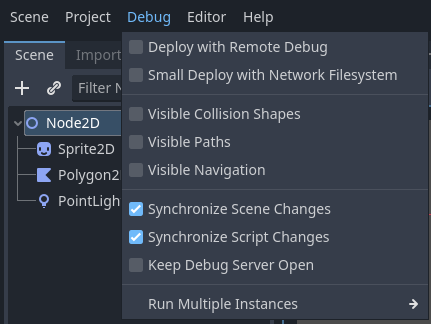
下面是这些选项的说明:
使用远程调试部署
当导出和部署时, 产生的可执行文件将尝试连接到你的计算机的IP上进行调试.
使用网络文件系统进行小型部署
这个选项加快了在远程设备上进行大足迹游戏的测试.
当使用网络文件系统进行小型部署开启时,部署游戏不是导出整个游戏,而是建立一个最小的可执行文件。然后,编辑器通过网络提供项目中的文件。
另外,在 Android 系统上,游戏采用 USB 线部署,加快部署速度。
显示碰撞区域
这个选项使碰撞形状和射线传输节点在运行的游戏中可见.
同步场景修改
使用此选项, 在运行时对编辑器中的场景所做的任何更改都会立即显示. 当在设备上远程使用时, 这对网络文件系统来说更为有效.
同步脚本修改
任何被保存的脚本都会被重新加载到正在运行的游戏上. 当在设备上远程使用时, 这对网络文件系统来说更有效率.
脚本编辑器调试工具和选项
脚本编辑器有自己的一套调试工具,用于断点和两个选项。断点工具也可以在调试器的调试器选项卡中找到。
小技巧
You can create a breakpoint by clicking the gutter in the left of the script editor (on the left of the line numbers). When hovering this gutter, you will see a transparent red dot appearing, which turns into an opaque red dot after the breakpoint is placed by clicking. Click the red dot again to remove the breakpoint. Breakpoints created this way persist across editor restarts, even if the script wasn't saved when exiting the editor.
You can also use the breakpoint keyword in GDScript to create a
breakpoint that is stored in the script itself. Unlike breakpoints created by
clicking in the gutter, this keyword-based breakpoint is persistent across
different machines when using version control.
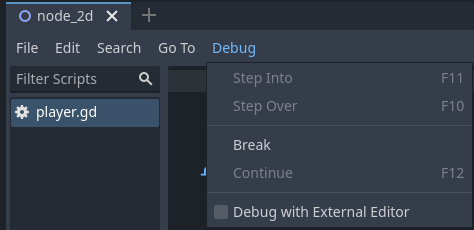
断点 按钮会像断点一样导致脚本的中断. 继续 使游戏在断点处暂停后继续. Step Over 进入下一行代码, 如果可能的话, Step Into 进入一个函数. 否则, 它与 Step Over 做同样的事情.
The Keep Debugger Open option keeps the debugger open after a scene has been closed. The Debug with External Editor option lets you debug your game with an external editor. This option is also accessible in Editor Settings > Debugger.
When the debugger breaks on a breakpoint, a green triangle arrow is visible in the script editor's gutter. This arrow indicates the line of code the debugger broke on.
调试项目设置
在项目设置中有一个 Debug(调试)类别,包含三个子类别,可以控制不同的东西。
Settings(设置)
这些都是一些常规的设置,比如将当前的 FPS 打印到输出面板,剖析时的最大函数量等。
GDScript
这些设置允许你切换特定的GDScript警告, 比如未使用的变量. 你也可以完全关闭警告.
Shapes(形状)
Shapes中你可以调整形状的颜色, 这些形状只出现在调试的目的, 如碰撞和导航形状.
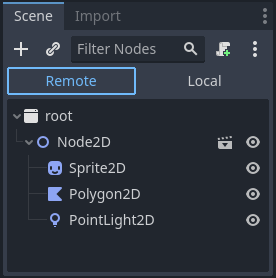
遥控场景面板
当在编辑器中运行游戏时,场景面板顶部会出现两个选项,即远程和本地。当使用远程时,你可以检查或改变运行项目中的节点参数。
备注
一些与调试有关的编辑器设置可以在 Editor Settings 内找到, 在 Network > Debug and Debugger 部分.