Attention: Here be dragons
This is the latest
(unstable) version of this documentation, which may document features
not available in or compatible with released stable versions of Godot.
Checking the stable version of the documentation...
Hotspot
Siehe auch
Please see the sampling profiler instructions for more information.
Open Hotspot. Click Record Data:
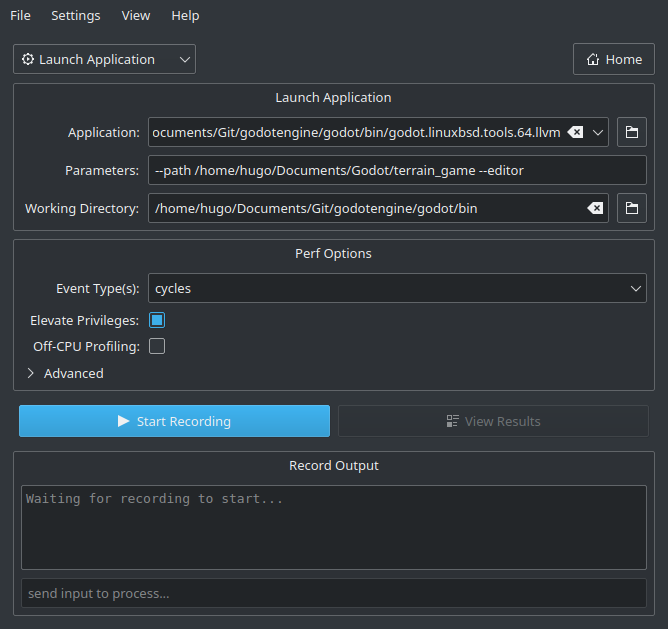
Im nächsten Fenster geben Sie den Pfad zur Godot-Binärdatei an, die Debug-Symbole enthält.
Geben Sie Kommandozeilenargumente an, um ein bestimmtes Projekt auszuführen, mit oder ohne Editor.
The path to the working directory can be anything if an absolute path is used for the
--pathcommand line argument. Otherwise, it must be set so that the relative path to the project is valid.Make sure Elevate Privileges is checked if you have administrative privileges. While not essential for profiling Godot, this will ensure all events can be captured. Otherwise, some events may be missing from the capture. Your settings should now look something like this:
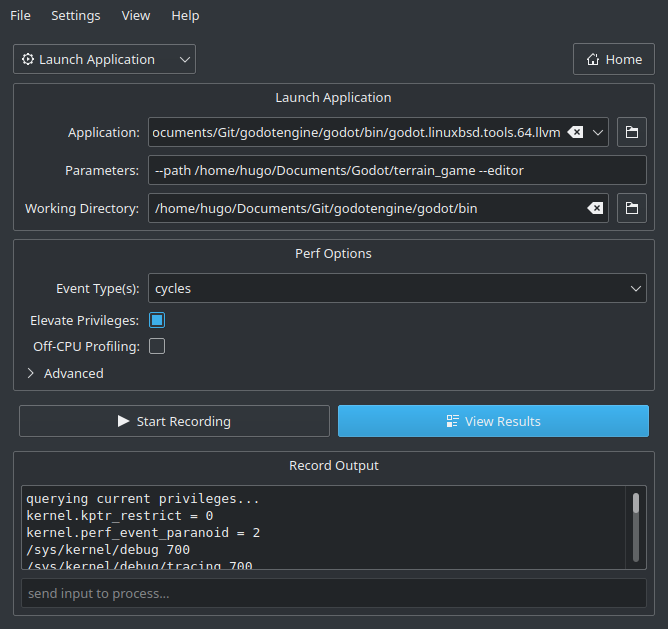
Klicken Sie auf Aufzeichnung starten und führen Sie die Aktionen aus, die Sie im Editor/Projekt profilen möchten.
Quit the editor/project normally or use the Stop Profiling button in Hotspot to stop profiling early. Stopping profiling early can result in cleaner profiles if you're not interested in the engine's shutdown procedure.
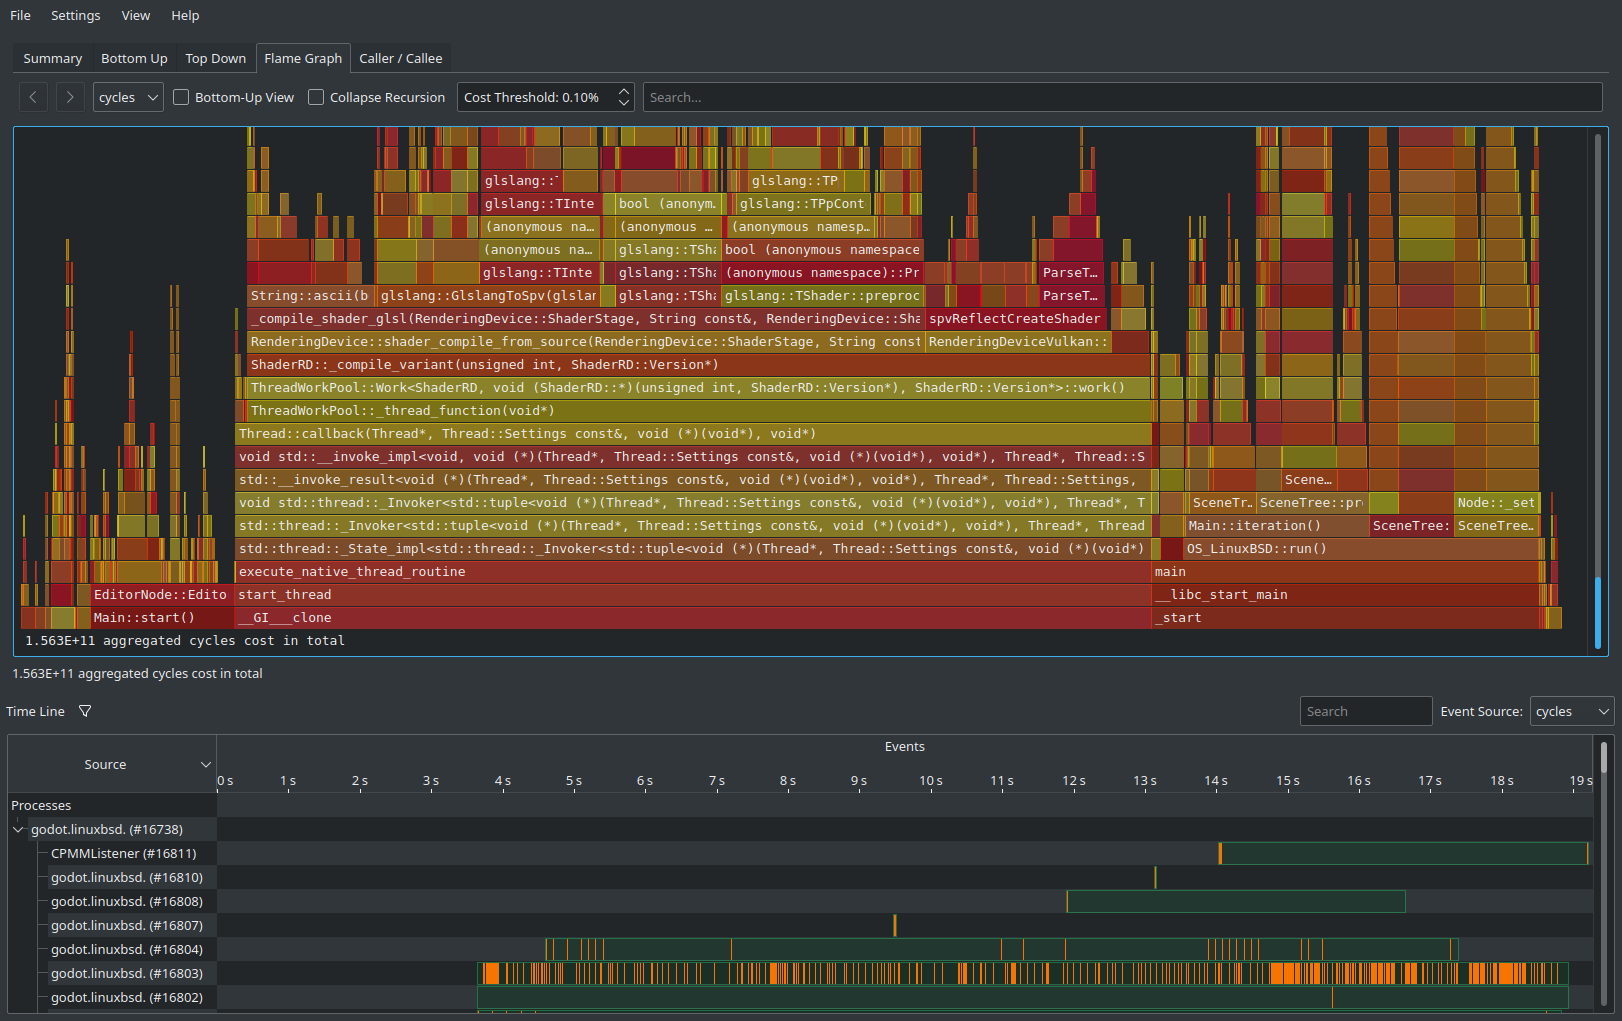
Klicken Sie auf Ergebnisse anzeigen und warten Sie, bis die Profiling-Visualisierung generiert wird:
Verwenden Sie die Tabs am oberen Rand, um zwischen den verschiedenen Ansichten zu navigieren. Diese Ansichten zeigen die gleichen Daten, aber auf unterschiedliche Weise. Der Tab Flammdiagramm ist eine gute Möglichkeit, um auf einen Blick zu sehen, welche Funktionen die meiste Zeit in Anspruch nehmen. Diese Funktionen sind daher die wichtigsten, die optimiert werden sollten, da eine Optimierung dieser Funktionen die Performance am meisten verbessert.
At the bottom of all tabs except Summary, you will also see a list of CPU threads started by the engine along with the CPU utilization for each thread. This lets you see threads that can be a bottleneck at a given point in time.
Bemerkung
If you don't want the startup procedure to be included in the profile, you can also attach Hotspot to a running process by clicking Record Data then setting the Launch Application dropdown option to Attach To Process(es).
Dieser auf Prozess-Anhängen basierende Workflow ähnelt dem von VerySleepy.