Attention: Here be dragons
This is the latest
(unstable) version of this documentation, which may document features
not available in or compatible with released stable versions of Godot.
Checking the stable version of the documentation...
Instruments
Siehe auch
Please see the sampling profiler instructions and the tracing profiler instructions for more information.
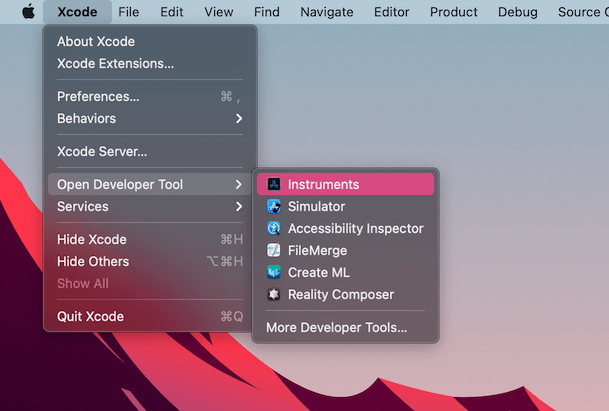
Open Xcode. Select Open Developer Tool - Instruments from the Xcode app menu:
Doppelklicken Sie auf Time Profiler im Fenster Instrumente:
In the Time Profiler window, click on the Target menu, select Choose target... and specify the path to the Godot binary, command line arguments, and environment variables in the next window.
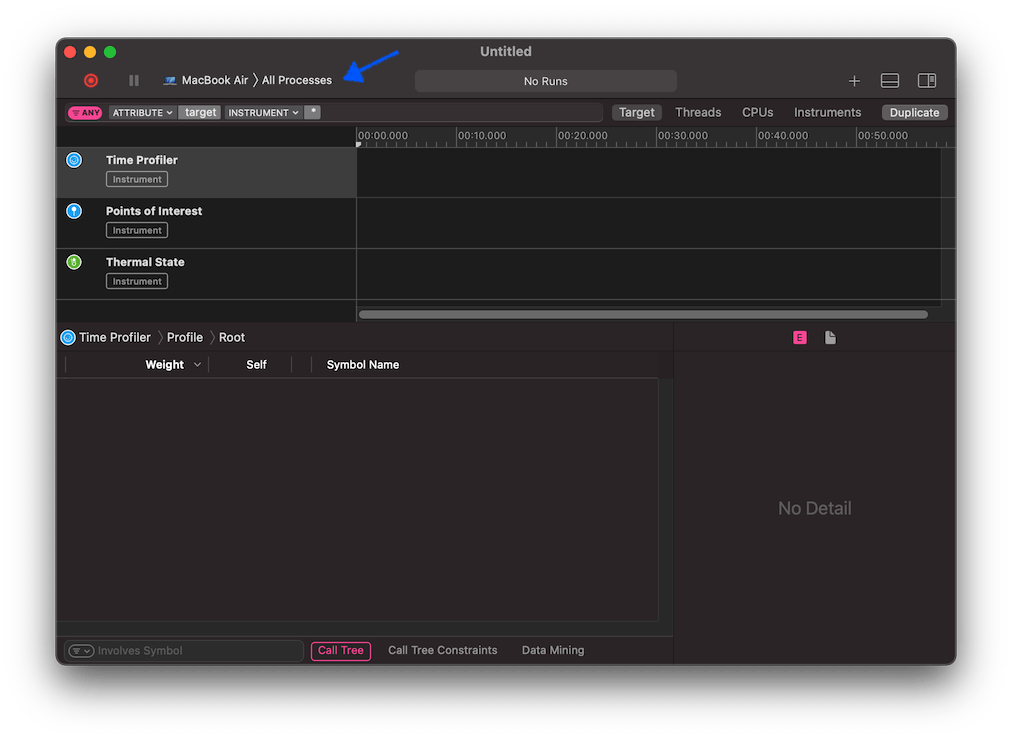
Sie können den Time Profiler auch an einen laufenden Prozess anhängen, indem Sie ihn aus dem Menü Ziel auswählen.
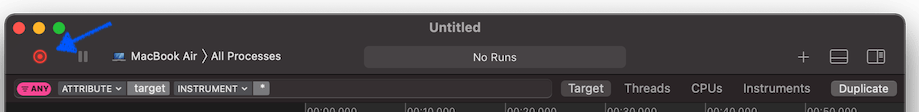
Klicken Sie auf den Sofortaufnahme starten-Button, um die Profilerstellung zu starten.
Führen Sie die Aktionen aus, die Sie im Editor oder im Projekt profilen möchten. Wenn Sie fertig sind, klicken Sie auf den Stop-Button.
Warten Sie, bis die Ergebnisse angezeigt werden.
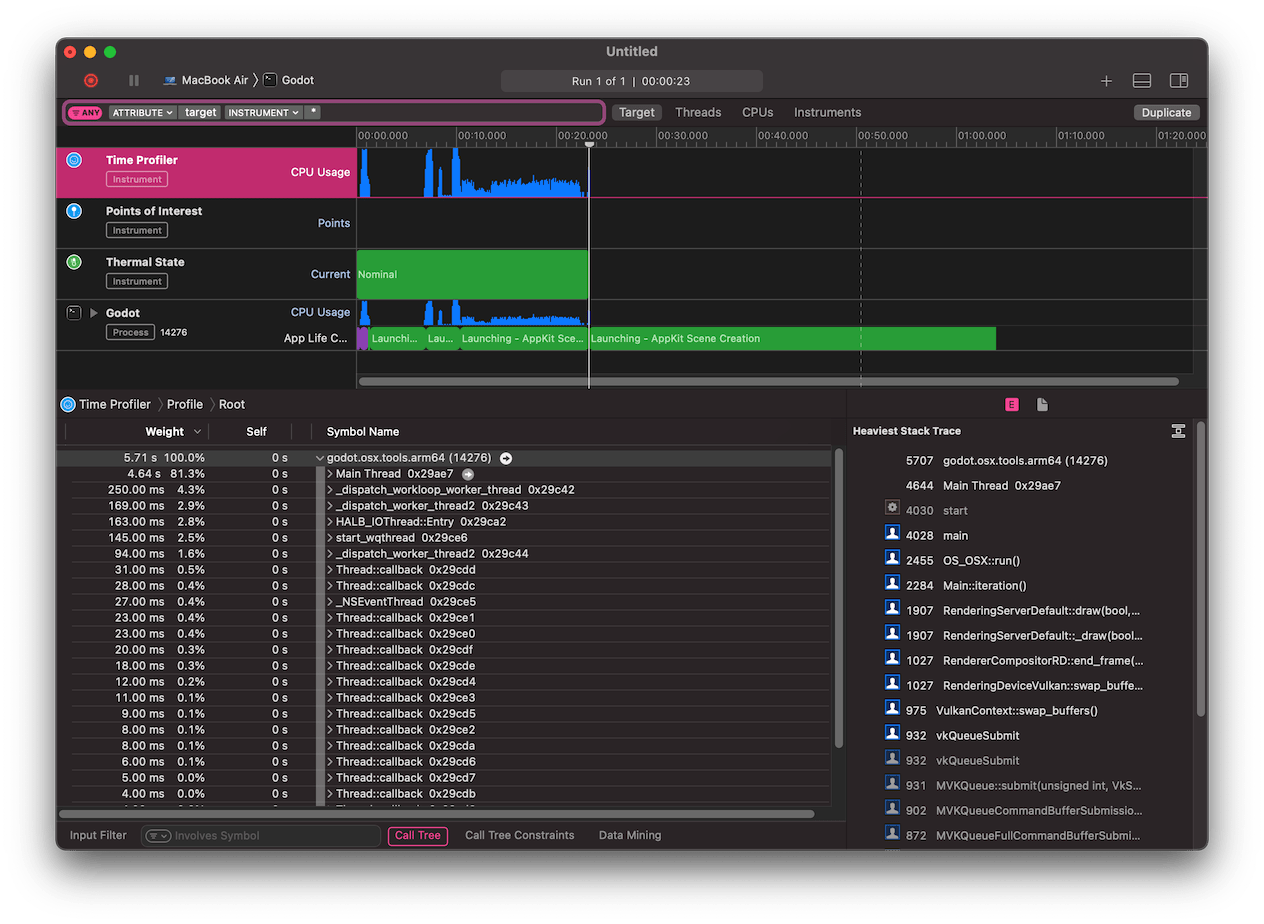
Im unteren Teil des Fensters sehen Sie einen Aufrufbaum für alle gestarteten CPU-Threads und die Übersicht Heaviest Stack Trace.
Select Hide system libraries in the Call Tree menu (at the bottom of the window) to remove external modules.
Sie können die Zeitleiste am oberen Rand des Fensters verwenden, um Details für den jeweiligen Zeitraum anzuzeigen.