JetBrains Rider
JetBrains Rider is a commercial JetBrains IDE for C++, C# and GDScript that uses the same solution system as Visual Studio.
Nota
This documentation is for contributing to the game engine, not for using JetBrains Rider as a C# or GDScript editor. To code C# or GDScript in an external editor, see the C# guide to configure an external editor.
Importare il progetto
Suggerimento
Se si utilizza già Visual Studio come IDE principale, è possibile utilizzare lo stesso file di soluzione in Rider. Rider e Visual Studio utilizzano lo stesso formato di soluzione, quindi è possibile passare da un IDE all'altro senza dover ricostruire il file di soluzione. Le configurazioni di debug si devono cambiare quando si passa da un IDE all'altro.
If you are starting from the scratch, please follow instructions, specifically:
Installa tutte le dipendenze.
Figure out the scons command for compiling to target a specific platform.
Provide scons with additional arguments to request a solution file generation:
Add vsproj=yes dev_build=yes to the scons command
The vsproj parameter signals that you want Visual Studio solution generated.
The dev_build parameter ensures the debug symbols are included, allowing to e.g. step through code using breakpoints.
Open the generated
godot.slnin Rider.
Nota
Ensure that the appropriate Solution configuration is selected on the Rider toolbar. It affects resolve of the SDKs, code analysis, build, run, etc.
Compilazione e debug del progetto
Rider comes with a built-in debugger that can be used to debug the Godot project. You can launch the debugger by pressing the Debug icon at the top of the screen, this only works for the Project Manager, if you want to debug the editor, you need to configure the debugger first.

Clicca sull'opzione Godot > Modifica configurazioni nella parte superiore dello schermo.

Verificare i seguenti valori per la configurazione di esecuzione del progetto C++:
Exe Path :
$(LocalDebuggerCommand)Program Arguments:
-e --path <path to the Godot project>Working Directory:
$(LocalDebuggerWorkingDirectory)Before Launch has a value of "Build Project"
This will tell the executable to debug the specified project without opening the Project Manager.
Use the root path to the project folder, not project.godot file path.

Infine cliccare su "Apply" e "OK" per salvare le modifiche.
Premendo l'icona Debug nella parte superiore dello schermo, JetBrains Rider avvierà l'editor Godot con il debugger collegato.
In alternativa, è possibile utilizzare Run > Attach to Process per collegare il debugger a un'istanza di Godot in esecuzione.
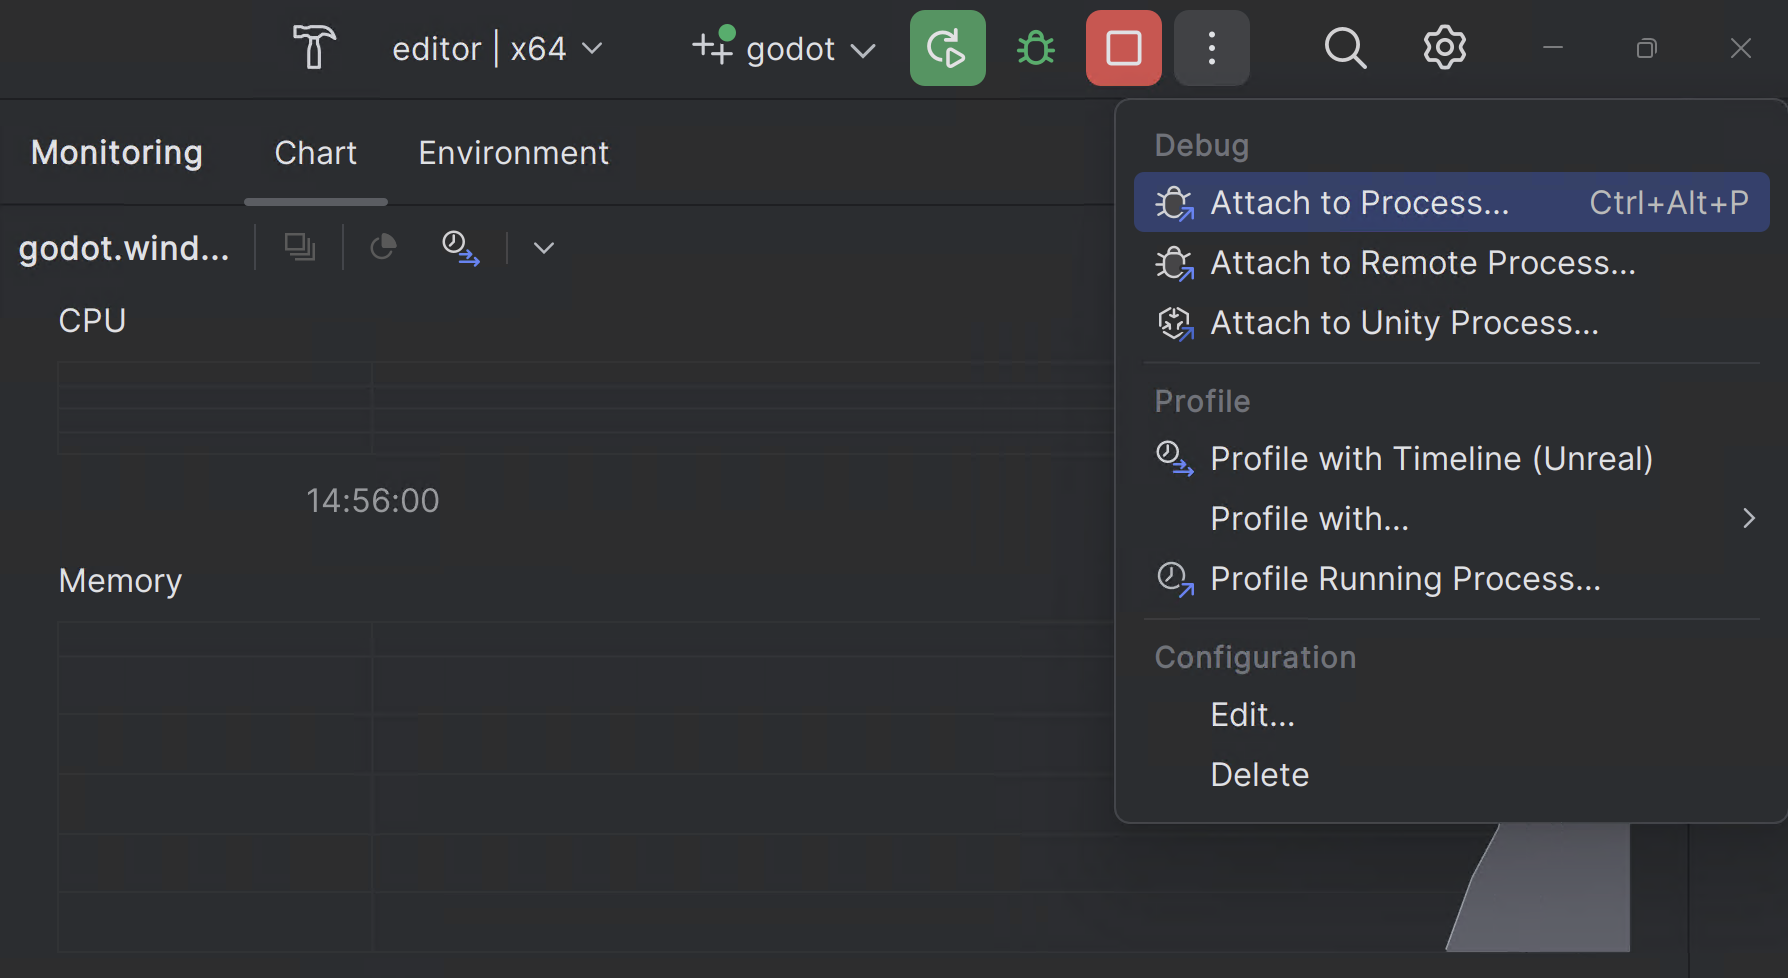
Si può trovare l'istanza di Godot cercando
godot.editore poi cliccandoAttach with LLDB

Debug visualizers
Debug visualizers customize how complex data structures are displayed during debugging. For Windows "natvis" (short for "Native Visualization") built-in with Godot are automatically used. For other operating systems, similar functionality can be setup manually.
Please follow RIDER-123535.
Test unitari
Leverage Rider doctest support. Please refer to the instructions.
Profiling
Please refer to the profiling instructions.
Si prega di consultare la documentazione di JetBrains Rider per informazioni specifiche sull'IDE JetBrains.
Known issues
Debugging Windows MinGV build - symbols are not loaded. Reported RIDER-106816.