Attention: Here be dragons
This is the latest
(unstable) version of this documentation, which may document features
not available in or compatible with released stable versions of Godot.
Checking the stable version of the documentation...
Instruments
Ver também
Please see the sampling profiler instructions and the tracing profiler instructions for more information.
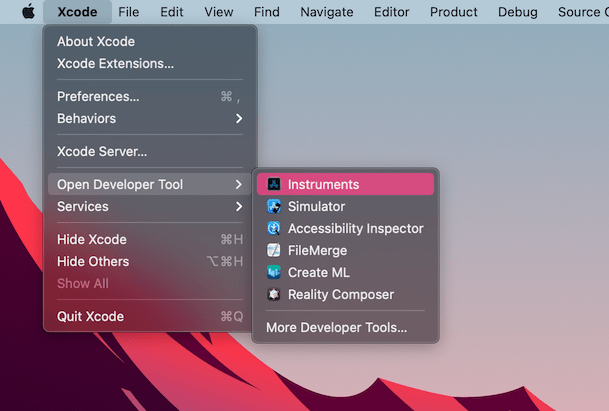
Open Xcode. Select Open Developer Tool - Instruments from the Xcode app menu:
Double-click on Time Profiler in the Instruments window:
In the Time Profiler window, click on the Target menu, select Choose target... and specify the path to the Godot binary, command line arguments, and environment variables in the next window.
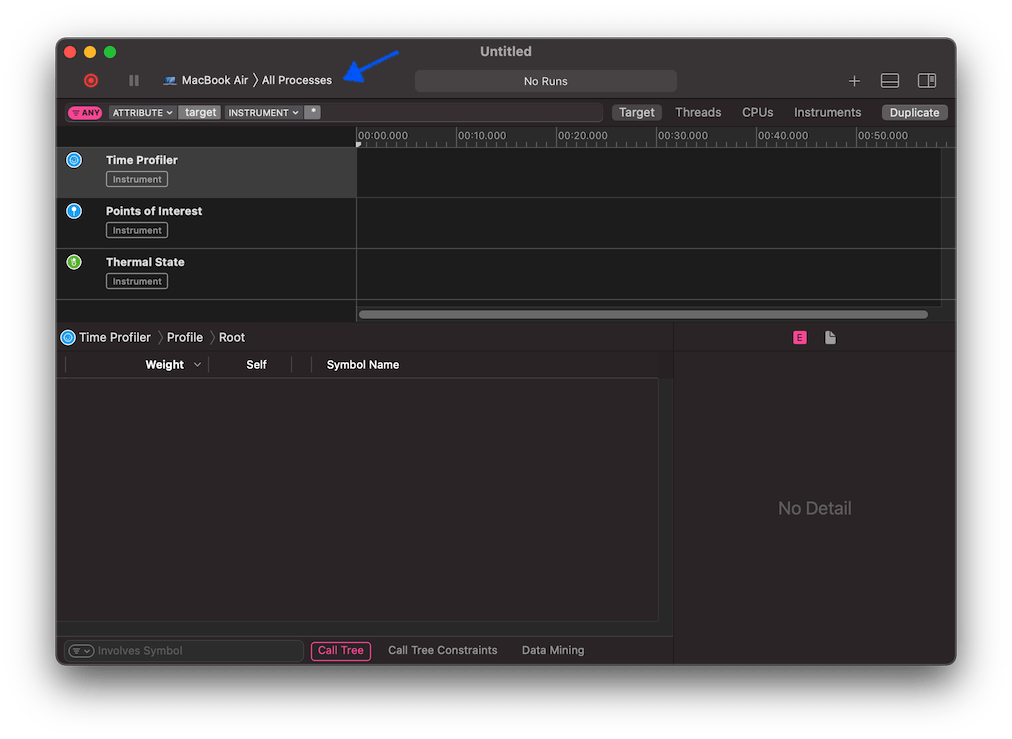
You can also attach the Time Profiler to a running process by selecting it from the Target menu.
Click the Start an immediate mode recording button to start profiling.
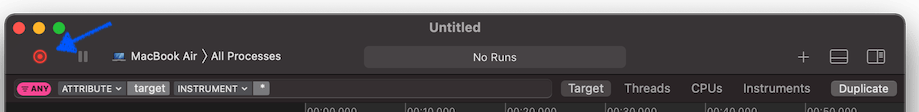
Perform the actions you wish to profile in the editor or project. When you're done, click the Stop button.
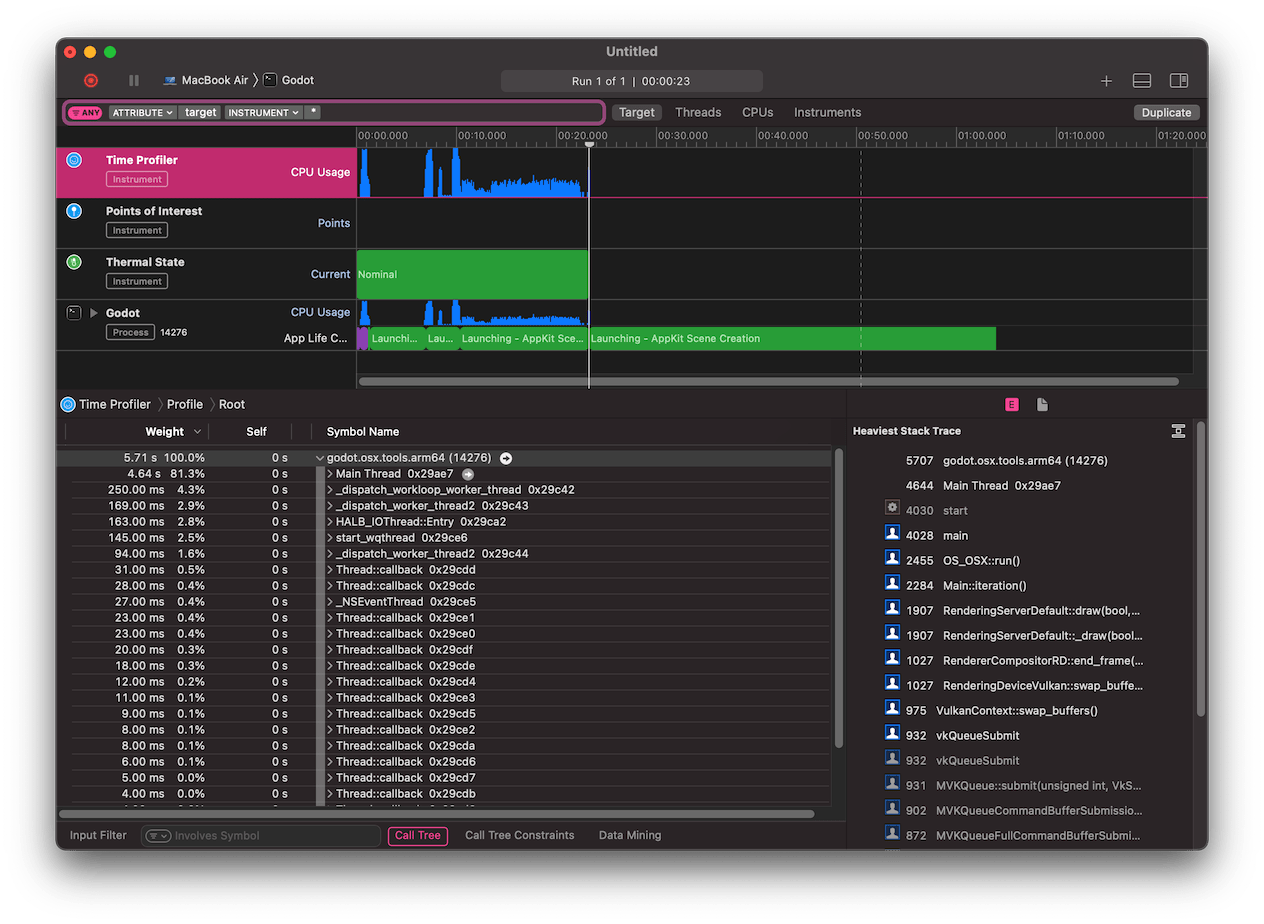
Wait for the results to appear.
Na parte inferior da janela, você verá uma árvore de chamadas para todos os threads de CPU iniciados e a visão geral do Heaviest Stack Trace.
Select Hide system libraries in the Call Tree menu (at the bottom of the window) to remove external modules.
You can use the timeline at the top of the window to display details for the specific time period.