Attention: Here be dragons
This is the latest
(unstable) version of this documentation, which may document features
not available in or compatible with released stable versions of Godot.
Checking the stable version of the documentation...
인수
더 보기
자세한 내용은 샘플링 프로파일러 지침 및 :ref:`추적 프로파일러 지침 <doc_tracing_profilers>`을 참조하세요.
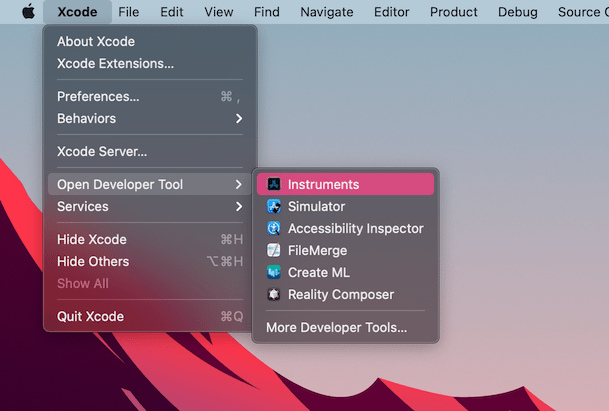
`Xcode <https://developer.apple.com/xcode/>`__을 엽니다. Xcode 앱 메뉴에서 개발자 도구 열기 - **Instruments**를 선택합니다.
Instruments 창에서 **Time Profiler**를 두 번 클릭합니다.
Time Profiler 창에서 대상 메뉴를 클릭하고 **대상 선택...**을 선택한 후 다음 창에서 Godot 바이너리 경로, 명령줄 인수 및 환경 변수를 지정하세요.
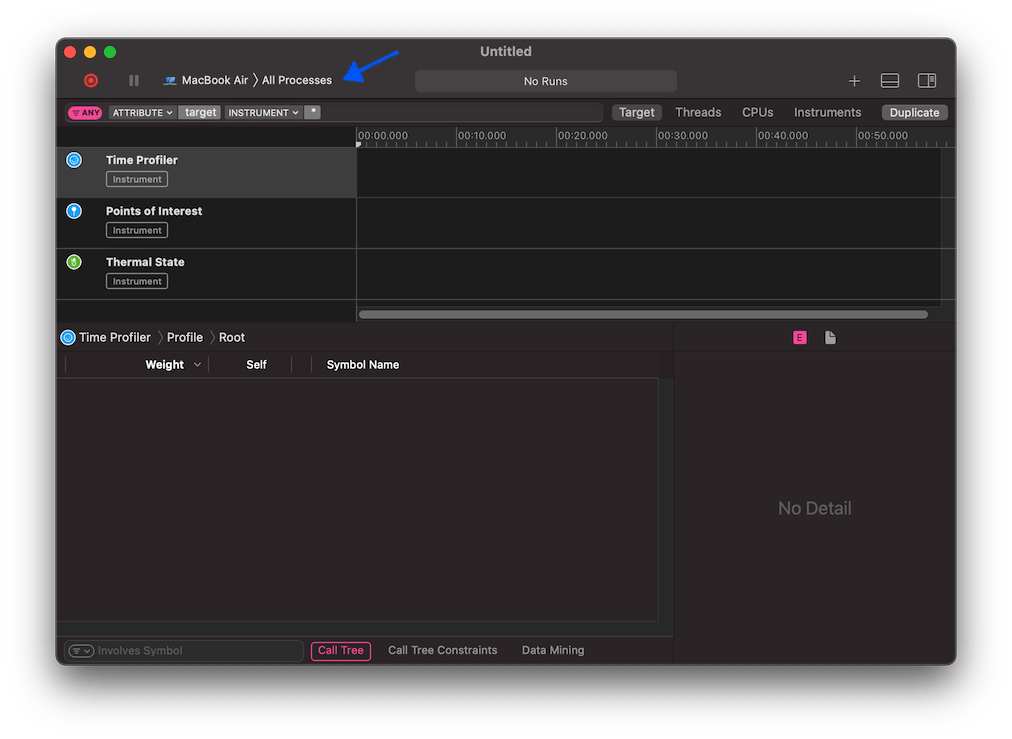
대상 메뉴에서 Time Profiler를 선택하여 실행 중인 프로세스에 연결할 수도 있습니다.
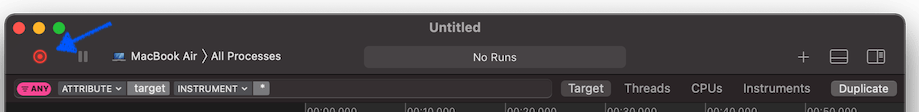
프로파일링을 시작하려면 즉시 모드 녹화 시작 버튼을 클릭하세요.
편집기나 프로젝트에서 프로파일링하려는 작업을 수행하세요. 완료되면 중지 버튼을 클릭하세요.
결과가 나타날 때까지 기다리십시오.
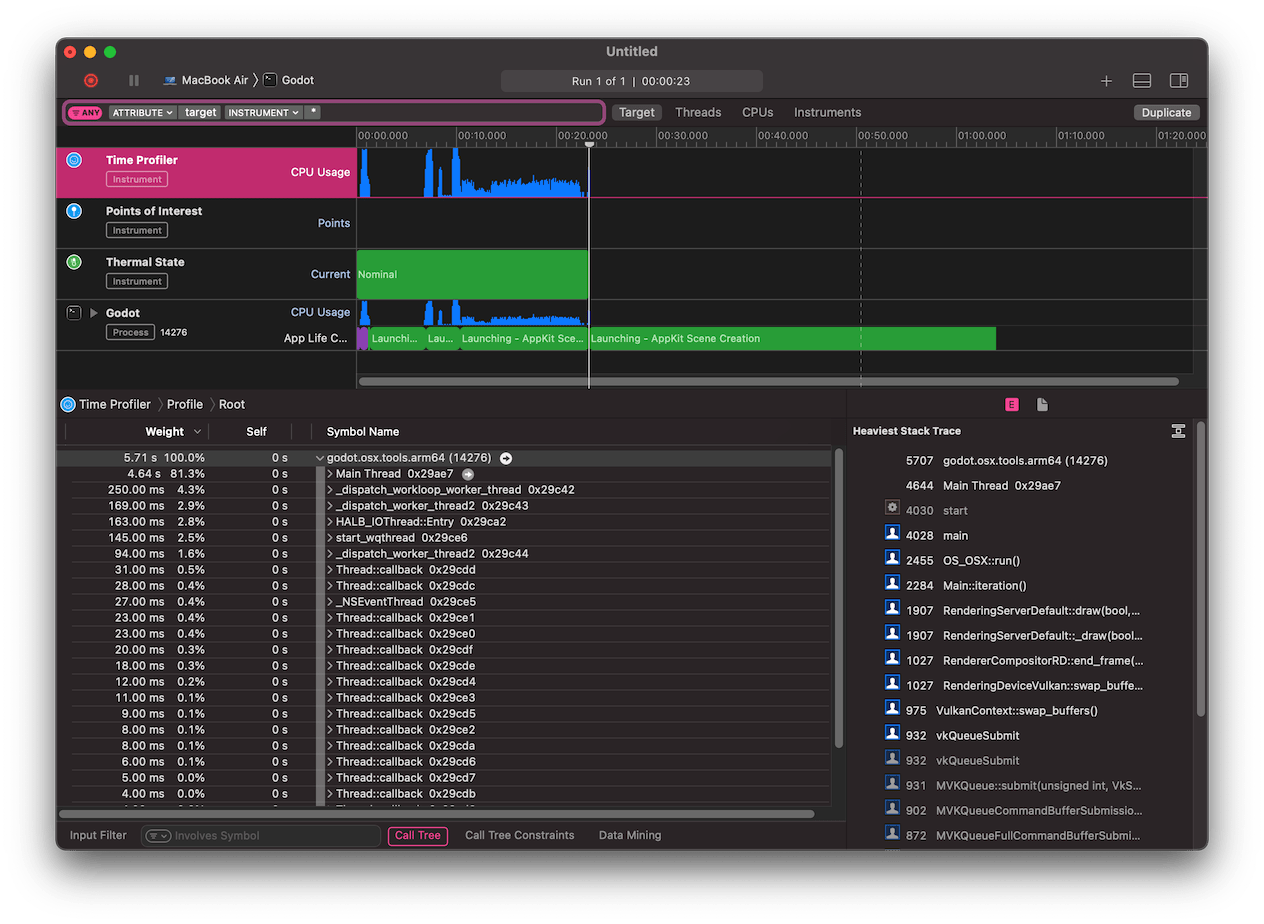
창 하단에는 시작된 모든 CPU 스레드에 대한 호출 트리와 가장 무거운 스택 추적 개요가 표시됩니다.
창 하단에 있는 콜 트리 메뉴에서 **시스템 라이브러리 숨기기**를 선택하여 외부 모듈을 제거합니다.
창 상단의 타임라인을 사용하여 특정 기간에 대한 세부 정보를 표시할 수 있습니다.