Attention: Here be dragons
This is the latest
(unstable) version of this documentation, which may document features
not available in or compatible with released stable versions of Godot.
Checking the stable version of the documentation...
doc_inspector_plugins
소개
디버거 문서에 설명된 대로 Godot는 시간에 따른 변화를 보여주는 그래프를 통해 다양한 값을 추적할 수 있는 디버거 > 모니터 하단 패널을 제공합니다. 해당 그래프의 데이터는 엔진의 Performance 싱글톤에서 가져옵니다.
Godot를 사용하면 모니터 탭에 표시될 사용자 정의 값을 선언할 수 있습니다. 사용자 정의 성능 모니터의 사용 사례 예는 다음과 같습니다.
프로젝트와 관련된 성능 지표를 표시합니다. 예를 들어 복셀 게임에서는 성능 모니터를 만들어 매초 로드되는 청크 수를 추적할 수 있습니다.
성능과 엄격하게 관련되지는 않지만 디버깅 목적으로 그래프를 작성하는 데 여전히 유용한 게임 내 지표를 표시합니다. 예를 들어 게임에 존재하는 적의 수를 추적하여 생성 메커니즘이 의도한 대로 작동하는지 확인할 수 있습니다.
커스텀 노드 생성하기
이 예에서는 현재 실행 중인 프로젝트에 얼마나 많은 적들이 존재하는지 추적하기 위해 사용자 정의 성능 모니터를 생성하겠습니다.
메인 씬에는 다음 스크립트가 연결된 Timer 노드가 있습니다.
extends Timer


func _ready():
    # The slash delimiter is used to determine the category of the monitor.
    # If there is no slash in the monitor name, a generic "Custom" category
    # will be used instead.
    Performance.add_custom_monitor("game/enemies", get_enemy_count)
    timeout.connect(_on_timeout)
    # Spawn 20 enemies per second.
    wait_time = 0.05
    start()


func _on_timeout():
    var enemy = preload("res://enemy.tscn").instantiate()
    get_parent().add_child(enemy)


# This function is called every time the performance monitor is queried
# (this occurs once per second in the editor, more if called manually).
# The function must return a number greater than or equal to 0 (int or float).
func get_enemy_count():
    return get_tree().get_nodes_in_group("enemies").size()
:ref:`Performance.add_custom_monitor<class_Performance_method_add_custom_monitor>`의 두 번째 매개변수는 :ref:`class_Callable`입니다.
``enemy.tscn``는 Node2D 루트 노드 및 타이머 자식 노드가 포함된 씬입니다. Node2D에는 다음 스크립트가 연결되어 있습니다.
extends Node2D


func _ready():
    add_to_group("enemies")
    $Timer.timeout.connect(_on_timer_timeout)
    # Despawn enemies 2.5 seconds after they spawn.
    $Timer.wait_time = 2.5
    $Timer.start()


func _on_timer_timeout():
    queue_free()
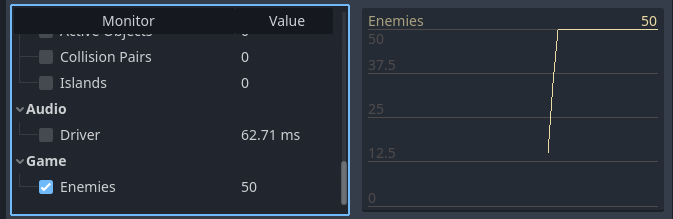
이 예에서는 초당 20명의 적을 생성하고 각 적이 생성된 후 2.5초 후에 사라지기 때문에 씬에 있는 적의 수가 50으로 안정화될 것으로 예상합니다. 그래프를 보면 이를 확인할 수 있습니다.
이 사용자 정의 성능 모니터에서 생성된 그래프를 시각화하려면 프로젝트를 실행하고, 프로젝트가 실행되는 동안 편집기로 전환하고 편집기 창 하단에 있는 디버거 > 모니터**를 엽니다. 새로 사용 가능한 **게임 섹션까지 아래로 스크롤하고 **적**을 확인하세요. 다음과 같은 그래프가 표시됩니다.
커스텀 노드 생성하기
참고
성능 모니터 처리 코드는 노드 자체와 동일한 스크립트에 있을 필요는 없습니다. 대신 성능 모니터 등록 및 getter 기능을 :ref:`autoload <doc_singletons_autoload>`으로 이동하도록 선택할 수도 있습니다.
성능 측정 툴.
편집기가 아닌 실행 중인 프로젝트 창에 성능 모니터 값을 표시하려면 ``Performance.get_custom_monitor("category/name")``를 사용하여 사용자 정의 모니터 값을 가져옵니다. Label, RichTextLabel, 2D에서 커스텀 그리기, 3D 텍스트 등을 사용하여 값을 표시할 수 있습니다.
이 방법은 내보낸 프로젝트(디버그 및 릴리스 모드)에서도 사용할 수 있으므로 편집기 외부에서 시각화를 만들 수 있습니다.