Attention: Here be dragons
This is the latest
(unstable) version of this documentation, which may document features
not available in or compatible with released stable versions of Godot.
Checking the stable version of the documentation...
Aperçu des outils de débogage
Ce guide vous donnera un aperçu des outils de débogage disponibles dans le moteur.
Godot est doté d'un puissant débogueur et de profileurs qui permettent de repérer les bogues, d'inspecter votre jeu à l'exécution, de surveiller les paramètres essentiels et de mesurer les performances. Il offre également des options permettant de visualiser les boîtes de collision et les polygones de navigation dans le jeu en cours d'exécution.
Enfin, vous avez la possibilité de déboguer le jeu en cours d'exécution sur un appareil distant et de recharger les modifications apportées à vos scènes ou à votre code pendant le déroulement du jeu.
Output Panel
The output panel allows you to see text printed by the project, but also by the editor (e.g. from @tool scripts).
You can find information about in Output panel.
Panneau de débogage
De nombreux outils de débogage de Godot font partie du panneau de débogage, sur lequel vous pouvez trouver des informations dans Panneau de débogage.
Options du menu de débogage
Il existe quelques options de débogage courantes que vous pouvez activer ou désactiver lorsque vous exécutez votre jeu dans l'éditeur, ce qui peut vous aider à déboguer votre jeu.
Vous pouvez trouver ces options dans le menu de l'éditeur Debug.
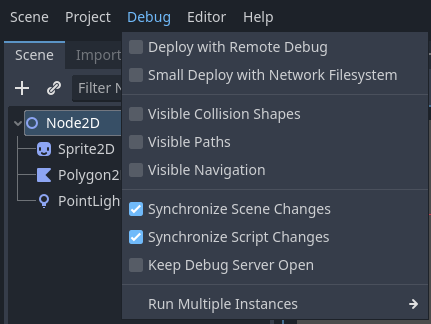
Voici les descriptions des options :
Déployer avec le débogage distant
When this option is enabled, using one-click deploy will make the executable attempt to connect to this computer's IP so the running project can be debugged. This option is intended to be used for remote debugging (typically with a mobile device). You don't need to enable it to use the GDScript debugger locally.
Small Deploy with Network Filesystem
Cette option accélère les tests pour les jeux avec une grande empreinte sur les appareils distants.
When Small Deploy with Network Filesystem is on, instead of exporting the full game, deploying the game builds a minimal executable. The editor then provides files from the project over the network.
De plus, sur Android, le jeu est déployé à l'aide du câble USB pour accélérer le déploiement.
Formes de collision visibles
When this option is enabled, collision shapes and raycast nodes (for 2D and 3D) will be visible in the running project.
Visible Paths
When this option is enabled, curve resources used by path nodes will be visible in the running project.
Visible Avoidance
When this option is enabled, avoidance object shapes, radiuses, and velocities will be visible in the running project.
Debug CanvasItem Redraws
When this option is enabled, redraw requests of 2D objects will become visible (as a short flash) in the running project. This is useful to troubleshoot low processor mode.
Synchronize Scene Changes
When this option is enabled, any changes made to the scene in the editor will be replicated in the running project. When used remotely on a device, this is more efficient when the network filesystem option is enabled.
Synchronize Script Changes
When this option is enabled, any changes made to the script in the editor will be reloaded in the running project. When used remotely on a device, this is more efficient with the network filesystem.
Garder le serveur de débogage ouvert
When this option is enabled, the editor debug server will stay open and listen for new sessions started outside of the editor itself.
Personnaliser les instances d’exécution...
This opens a dialog allowing you to tell Godot to run multiple instances of the game at once, and to specify the command line arguments for each instance. This is especially useful when building and debugging multiplayer games.
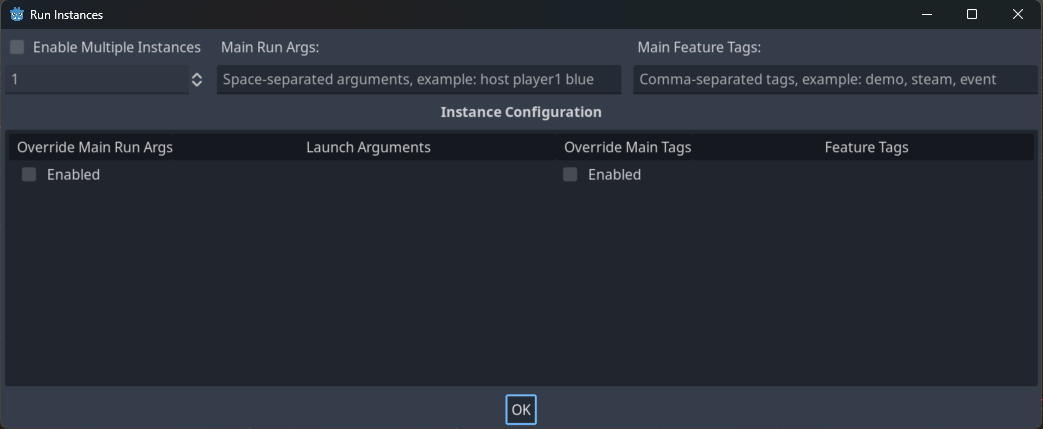
Enable Multiple Instances
When this option is enabled, the editor will run multiple instances of the project at once when you Run Project.
Below this checkbox is a selector to pick how many instances to run.
Checking the box and setting this to only 1 is the same as not checking this box at all.
Arguments d'exécution principaux
These are the arguments that will be passed to every instance of the project when you Run Project, unless you select "Enabled" under "Override Main Run Args" for a specific instance.
Note that these arguments are space-separated.
Astuce
These arguments can be accessed in your script by using get_cmdline_args.
Avertissement
Even if you uncheck "Enable Multiple Instances" these arguments will be passed when you Run Project.
Override Main Run Args
When this is enabled, the arguments in the "Main Run Args" field will not be passed to this specific instance of the project when you Run Project.
Launch Arguments
These are the arguments that will be passed to this specific instance of the project when you Run Project. They will be combined with the "Main Run Args" unless you select "Enabled" under "Override Main Run Args".
Outils et options de débogage de l'éditeur de script
L'éditeur de script possède son propre ensemble d'outils de débogage à utiliser avec les points d'arrêt(breakpoints) et deux options. Les outils de points d'arrêt se trouvent également dans l'onglet Debugger du débogueur.
Astuce
You can create a breakpoint by clicking the gutter in the left of the script editor (on the left of the line numbers). When hovering this gutter, you will see a transparent red dot appearing, which turns into an opaque red dot after the breakpoint is placed by clicking. Click the red dot again to remove the breakpoint. Breakpoints created this way persist across editor restarts, even if the script wasn't saved when exiting the editor.
You can also use the breakpoint keyword in GDScript to create a
breakpoint that is stored in the script itself. Unlike breakpoints created by
clicking in the gutter, this keyword-based breakpoint is persistent across
different machines when using version control.
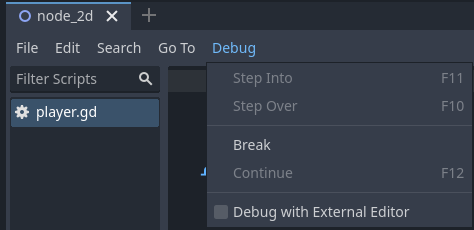
Le bouton Break provoque une rupture dans le script comme le ferait un point d'arrêt. Le bouton Continue permet de continuer le jeu après une pause à un point d'arrêt. Step Over passe à la ligne de code suivante, et Step Into passe dans une fonction si possible. Sinon, il fait la même chose que Step Over.
The Debug with External Editor option lets you debug your game with an external editor. You can set a shortcut for it in Editor Settings > Shortcuts > Debugger.
When the debugger breaks on a breakpoint, a green triangle arrow is visible in the script editor's gutter. This arrow indicates the line of code the debugger broke on.
Paramètres de débogage du projet
In the project settings, there is a Debug category with subcategories which control different things. Enable Advanced Settings to change these settings.
Paramètres
Il s'agit de quelques paramètres généraux tels que l'impression du FPS actuel sur le panneau Output, le nombre maximum de fonctions lors du profilage et autres.
File Logging
These settings allow you to log console output and error messages to files.
GDScript
These settings allow you to toggle specific GDScript warnings, such as for unused variables. You can also turn off warnings completely. See Système d’avertissement de GDScript for more information.
Shader Language
These settings allow you to toggle specific shader warnings, such as for unused variables. You can also turn off warnings completely.
Canvas Items
These settings are for canvas item redraw debugging.
Formes
Les formes permettent d'ajuster la couleur des formes qui n'apparaissent qu'à des fins de débogage, telles que les formes de collision et de navigation.
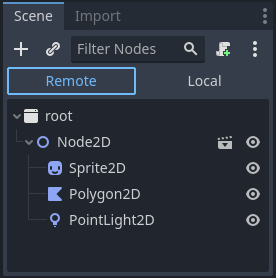
Remote dans le dock de scène
Lorsque vous lancez un jeu dans l'éditeur, deux options apparaissent en haut du dock Scene, Remote et Local. En utilisant Remote, vous pouvez inspecter ou modifier les paramètres des nœuds dans le projet en cours d'exécution.
Note
Certains paramètres de l'éditeur relatifs au débogage se trouvent dans les Paramètres de l'éditeur, sous les sections Network > Debug et Debugger.