Attention: Here be dragons
This is the latest
(unstable) version of this documentation, which may document features
not available in or compatible with released stable versions of Godot.
Checking the stable version of the documentation...
Godot 介面初探
本頁將向你簡要介紹 Godot 的介面。我們將看看不同的主螢幕和麵板,以説明你確定自己的位置。
也參考
如需編輯器介面及其使用方式的完整說明,請參閱「編輯器手冊」: 編輯器手冊。
專案管理員
當您啟動 Godot 時,首先看到的視窗是專案管理員。在預設的 專案 分頁中,您可以管理現有的專案、匯入或建立新的專案等等。
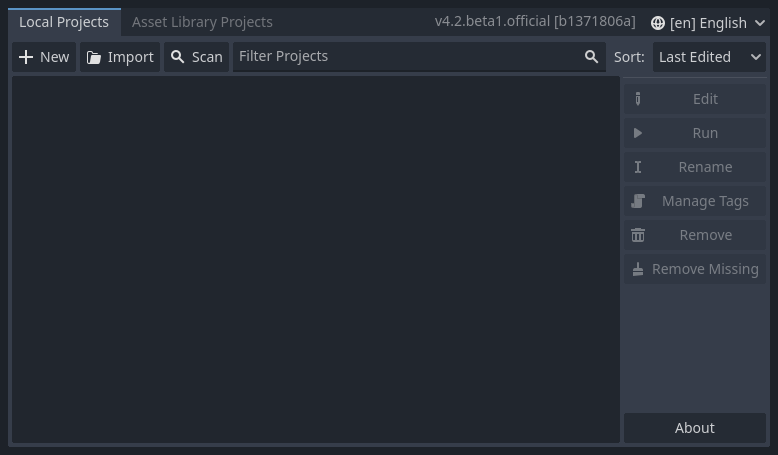
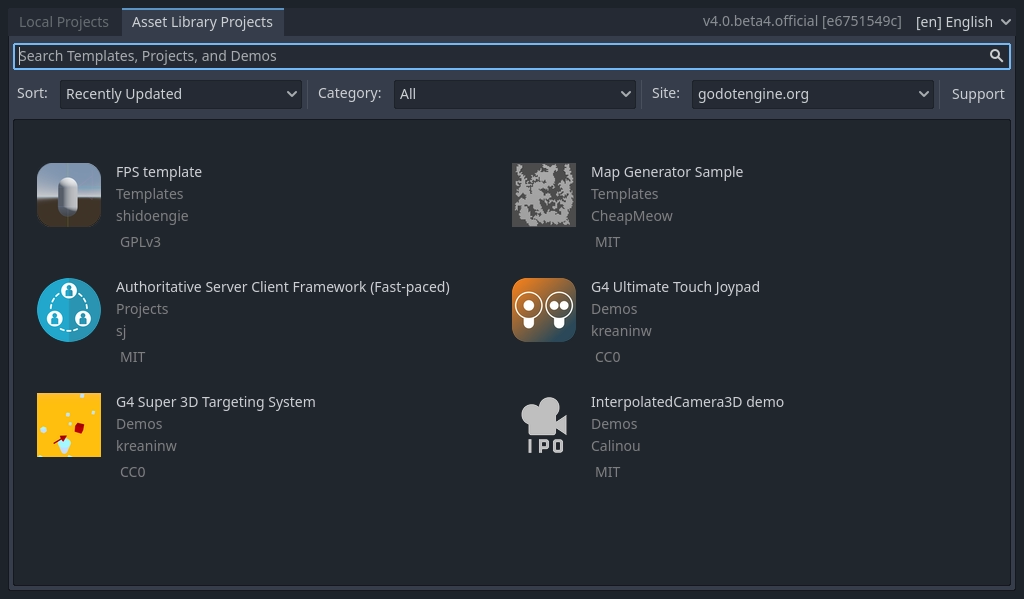
在視窗上方,還有另一個標籤頁叫做 Asset Library (素材庫)。第一次進入這個標籤頁時,你會看到一個「連線」按鈕。基於隱私考量,Godot 專案管理器預設不會存取網路。要更改這個設定,請點擊「連線」按鈕。你之後可以在設定中更改這個選項。
一旦您的網路模式設定為「線上」,您就可以在開放原始碼的素材庫中搜尋範例專案,其中包含許多社群開發的專案:
專案管理員的設定可以透過 設定 選單開啟:

在這裡,您可以變更編輯器的語言(預設為系統語言)、介面主題、顯示縮放、網路模式,以及目錄命名慣例。
也參考
要進一步瞭解專案管理器,請閱讀 專案管理員 。
初步認識 Godot 編輯器
當您開啟新的或現有的專案時,編輯器的介面就會出現。讓我們看看它的主要區域:
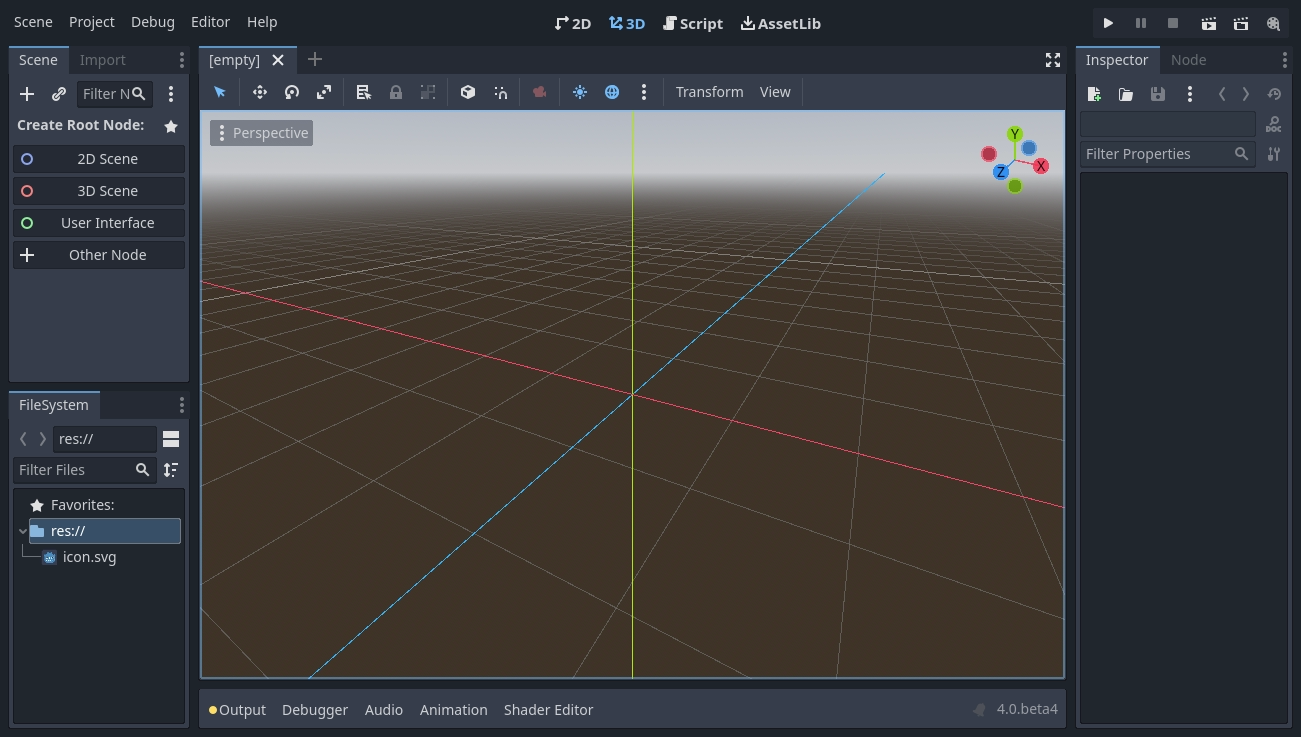
預設情況下,在視窗頂部邊緣,左側是**主選單**,中央是**工作區**切換按鈕(目前使用中的工作區會特別標示),右側是**測試執行**按鈕和**影片製作模式**切換開關:

在工作區按鈕的正下方,可以看到以分頁形式呈現的已開啟 場景。分頁旁邊的加號 (+) 按鈕會新增一個新的場景到專案中。最右邊的按鈕可以切換無干擾模式,這個模式會透過隱藏介面中的 停靠視窗 (docks) 來最大化或還原 視埠 (viewport) 的大小:

在中央,場景選擇器下方是 視埠 (viewport) ,上方有其 工具列 (toolbar) ,您可以在工具列中找到不同的工具來移動、縮放或鎖定場景中的節點(目前 3D 工作區為啟用狀態):
這個工具列會根據上下文和選取的節點而改變。以下是 2D 工具列:

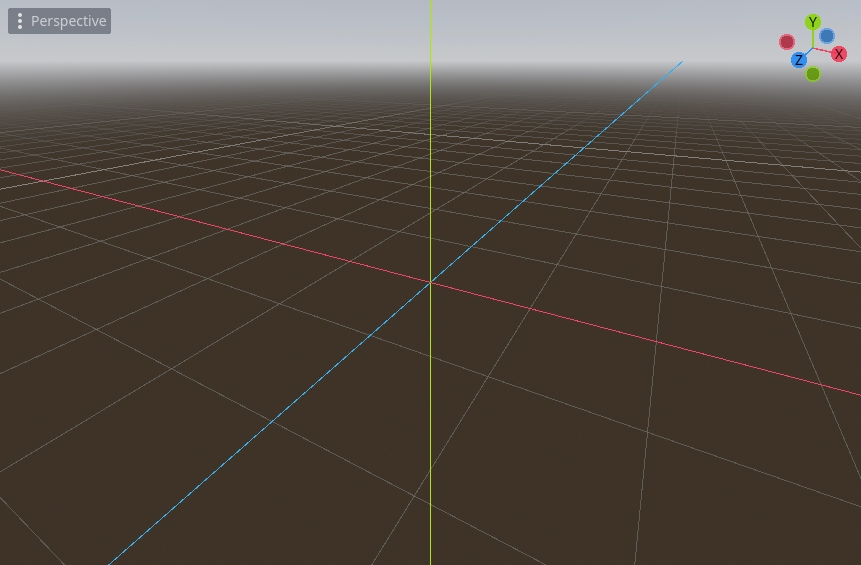
以下是 3D 的介面:

也參考
想更深入了解工作區,請閱讀 五個主要視窗。
也參考
想更深入了解 3D 視埠和 3D 相關知識,請參閱 3D 簡介。
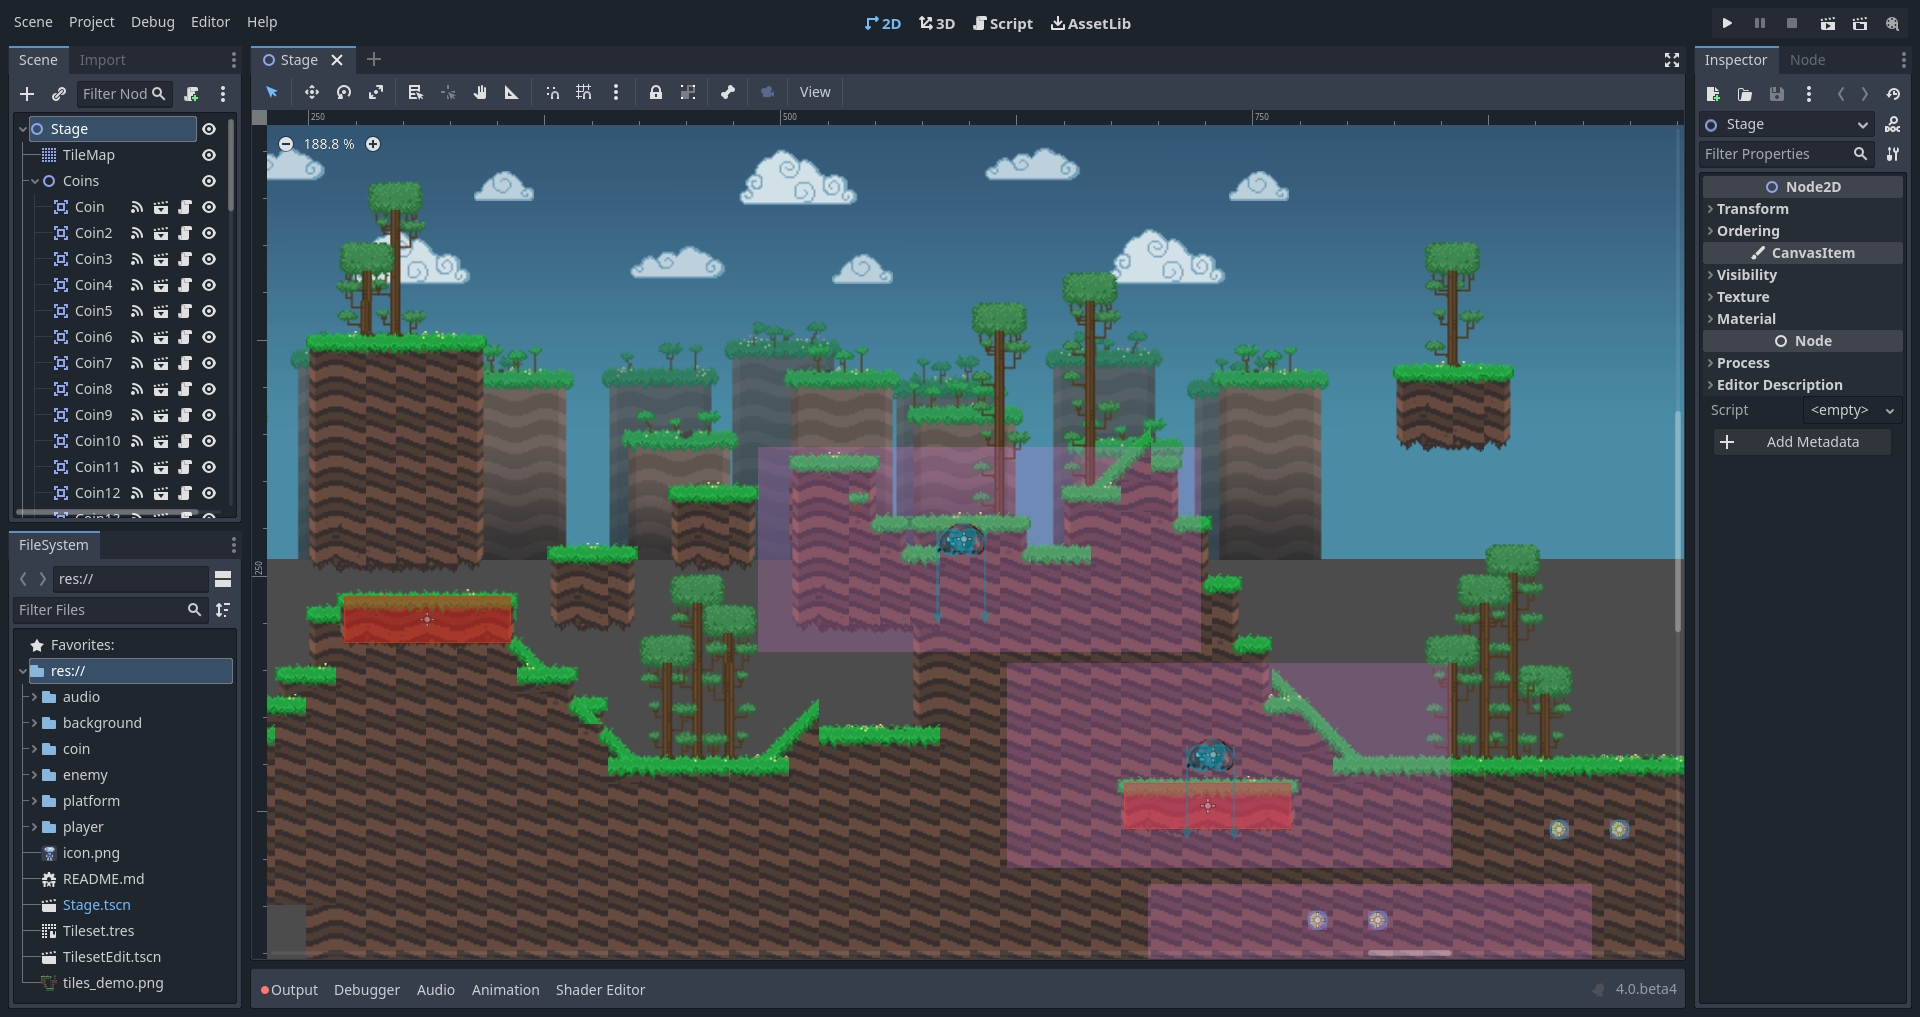
視口的兩邊是 停靠面板 。視窗底部則是 底部面板 。
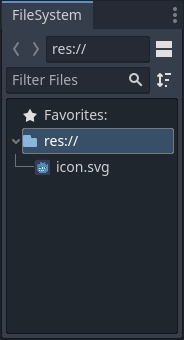
讓我們看看停靠視窗。檔案系統 停靠視窗列出了你的專案檔案,包含腳本、圖片、音訊樣本等等:
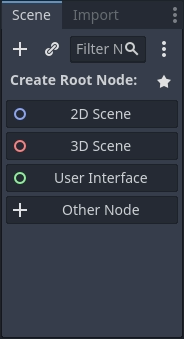
「場景」停靠視窗會列出目前場景的節點:
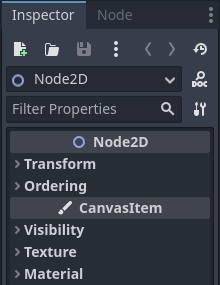
「 屬性編輯器 」 允許您編輯所選節點的屬性:
也參考
若要深入了解檢測器,請參閱 屬性檢視面板。
也參考
停靠視窗可以自訂。請參閱 面板的移動和大小調整 以了解更多資訊。
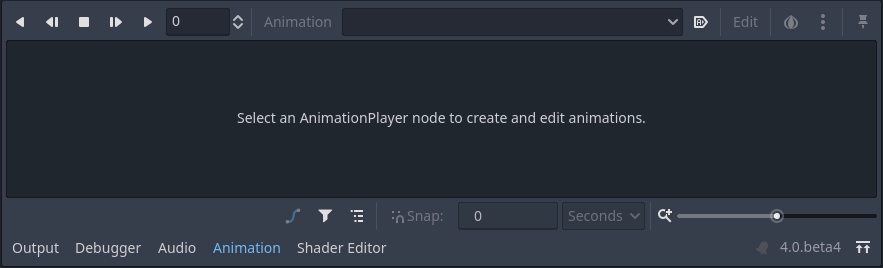
「 底部面板 」位於視埠下方,是除錯控制台、動畫編輯器、音訊混音器等工具的所在位置。它們可能會佔用寶貴的空間,因此預設是摺疊起來的:

當您點擊其中一個時,它會垂直展開。下方您可以看到動畫編輯器已開啟:
底部面板也可以透過在**編輯器設定 > 快捷鍵**中的**底部面板**類別下定義的快捷鍵來顯示或隱藏。
五個主要視窗
編輯器頂部中央有五個主要螢幕按鈕:2D、3D、腳本、遊戲和素材庫。
所有類型的遊戲都會使用 2D 畫面。除了 2D 遊戲之外,你也會在 2D 畫面中建立使用者介面。
在 3D 畫面 中,你可以處理網格模型、燈光,以及設計 3D 遊戲的關卡。
備註
關於 3D 工作區 的詳細介紹請參考 3D 簡介。
「遊戲畫面」是您的專案在編輯器中執行時會顯示的地方。您可以在專案中進行測試、暫停並即時調整。請注意,這僅用於測試調整的效果,當遊戲停止執行時,在此處進行的任何變更都不會儲存。

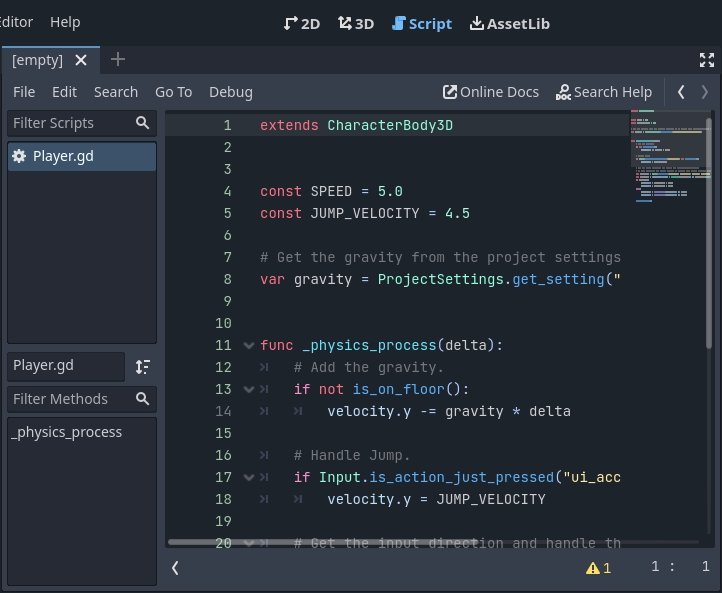
Script 螢幕 是一個完整的程式碼編輯器,包含除錯器、豐富的自動補全、內建程式碼參考手冊。
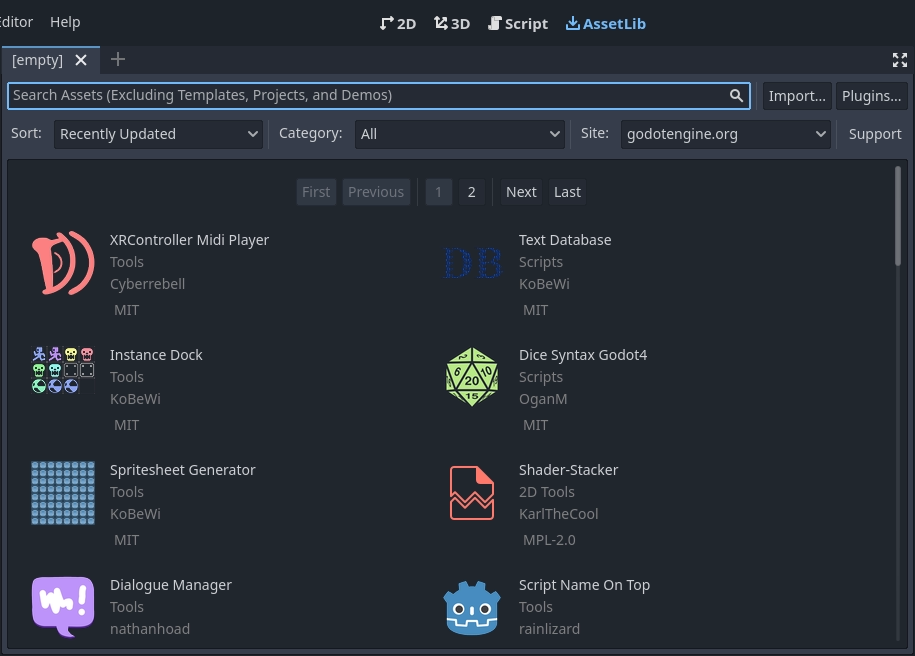
最後,「素材庫」是一個提供免費且開放原始碼的擴充功能、腳本和素材的集合,您可以在專案中使用它們。
也參考
你可以在 關於素材庫 中瞭解更多關於素材庫的內容。
如何撰寫類別參照文件
Godot 自帶內建類別參考手冊。
你搜尋有關類別、方法、屬性、常數或訊號的資訊時,可用以下方法:
在編輯器的任何地方按下 F1 (macOS 上是 Opt + 空格鍵,筆記型電腦若有 Fn 鍵則是 Fn + F1)。
點擊 Script 主螢幕右上角的“搜索説明”按鈕。
點擊“説明”功能表的“搜索説明”。
在腳本編輯器中,對著類別名稱、函式名稱或內建變數按下 Ctrl + 滑鼠左鍵 (macOS 上是 Cmd + 滑鼠左鍵)。

執行其中的任意操作都會彈出一個視窗。通過輸入進行搜索。你也可以用它來查看所有物件和方法。
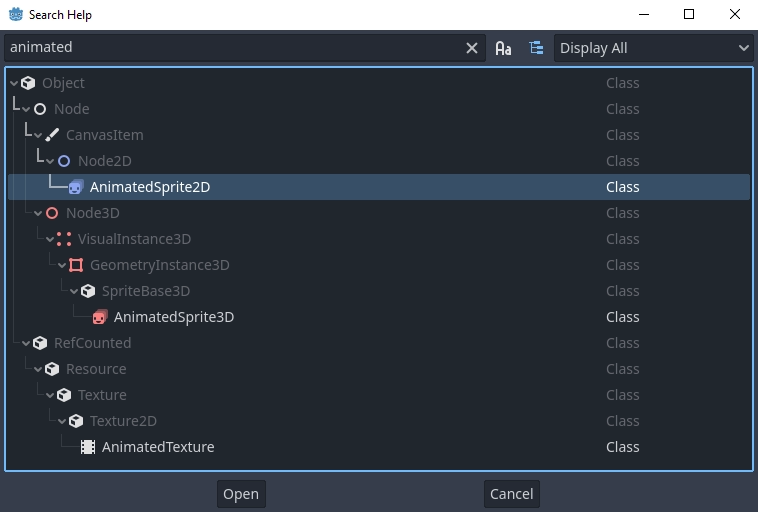
在條目上按兩下就會在腳本主螢幕中打開對應的頁面。
另一個選擇是
Clicking while pressing Ctrl (Cmd on macOS) on a class name, function name, or built-in variable in the script editor.
在節點上按一下滑鼠右鍵並選擇**開啟說明文件**,或是在腳本編輯器中針對元素選擇**查詢符號**,將會直接開啟其說明文件。