Attention: Here be dragons
This is the latest
(unstable) version of this documentation, which may document features
not available in or compatible with released stable versions of Godot.
Checking the stable version of the documentation...
Hotspot
也參考
Please see the sampling profiler instructions for more information.
Open Hotspot. Click Record Data:
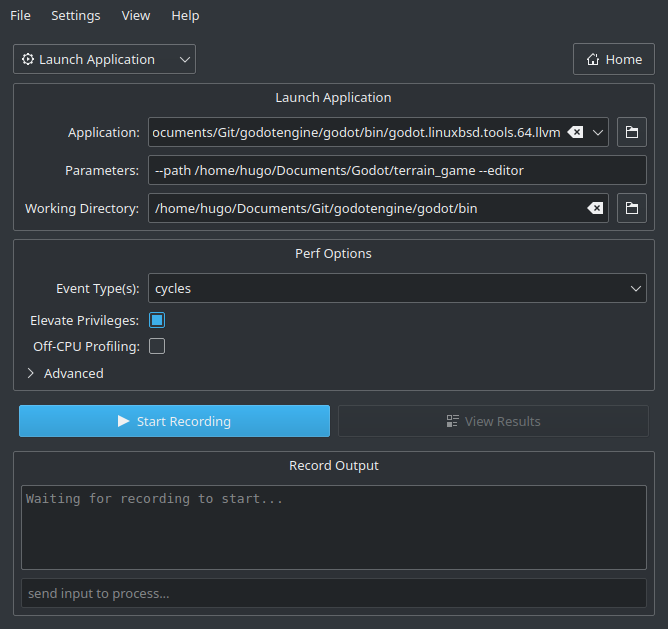
在下一個視窗中,指定包含除錯符號的 Godot 執行檔路徑。
可自行決定是否加入命令列參數,以選擇用編輯器或直接執行專案。
The path to the working directory can be anything if an absolute path is used for the
--pathcommand line argument. Otherwise, it must be set so that the relative path to the project is valid.Make sure Elevate Privileges is checked if you have administrative privileges. While not essential for profiling Godot, this will ensure all events can be captured. Otherwise, some events may be missing from the capture. Your settings should now look something like this:
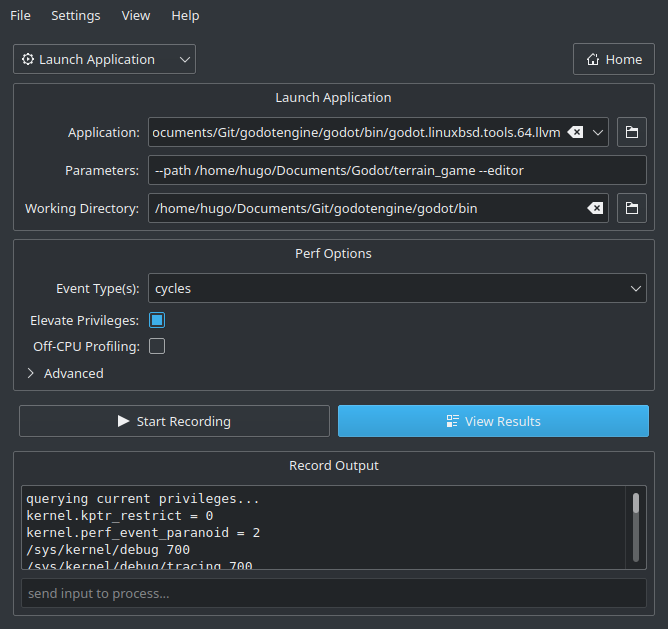
點擊 Start Recording,然後在編輯器或專案中執行你要分析的操作。
Quit the editor/project normally or use the Stop Profiling button in Hotspot to stop profiling early. Stopping profiling early can result in cleaner profiles if you're not interested in the engine's shutdown procedure.
點選 View Results,等待產生視覺化的效能分析結果:
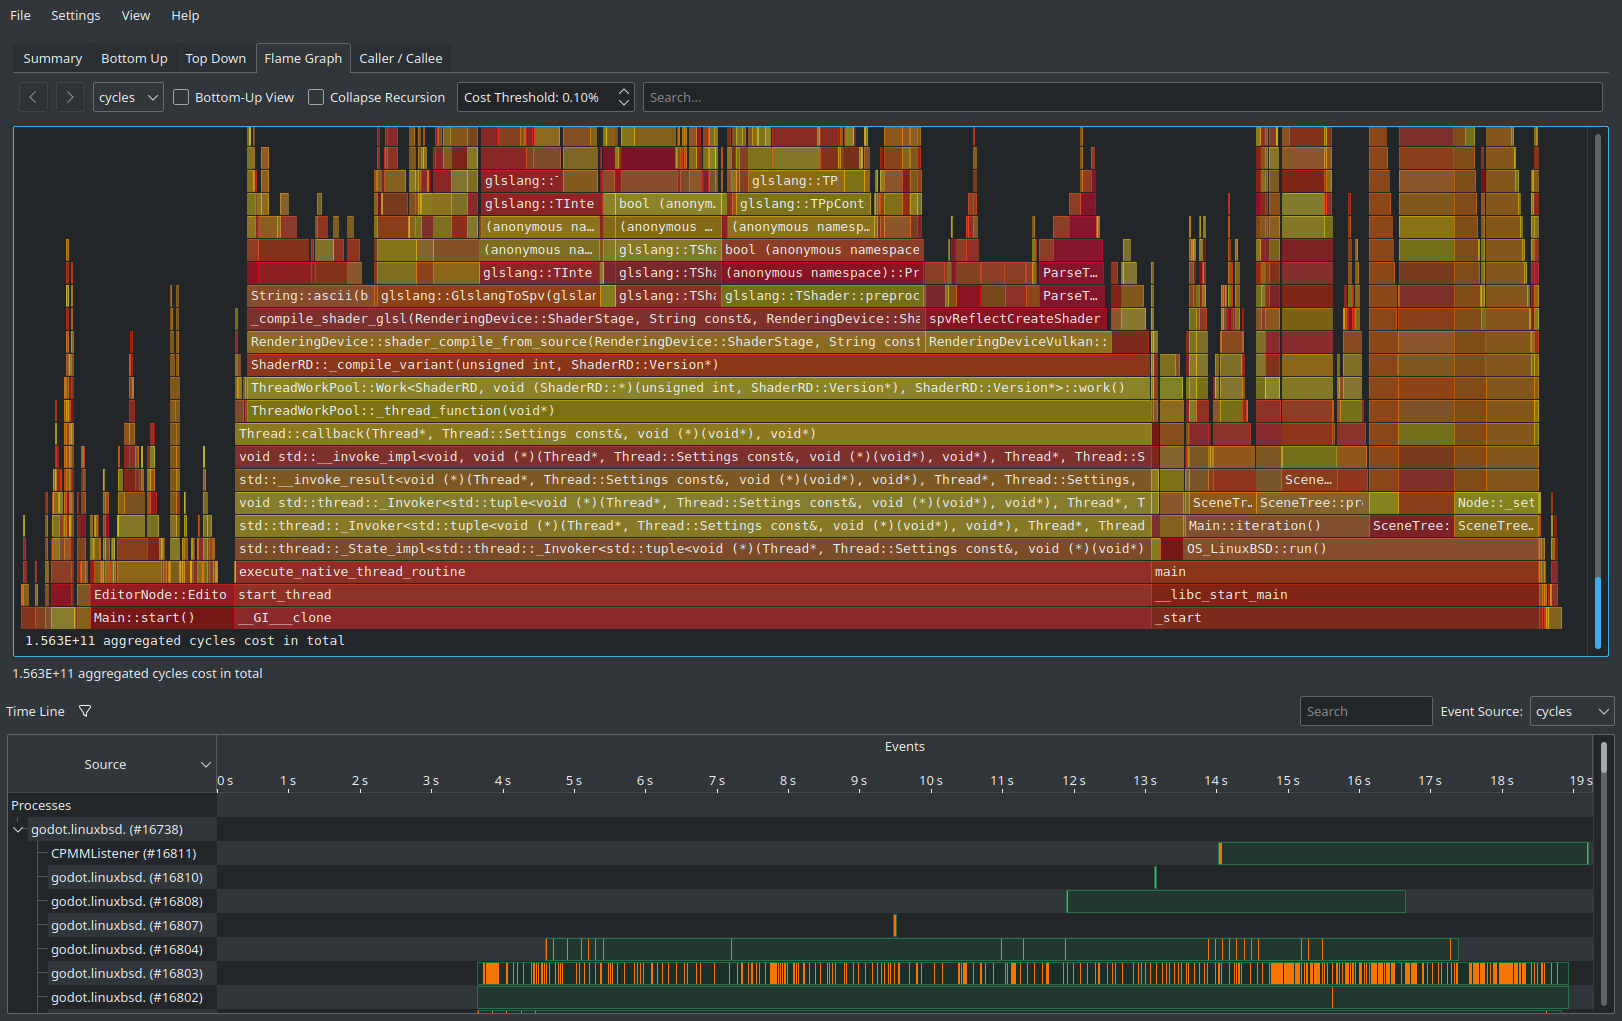
可利用上方分頁切換不同檢視模式,這些檢視僅是用不同方式展示相同資料。Flame Graph (火焰圖)分頁能一目了然哪些函式最耗時。這些函式便是最應優化的目標,因為優化它們能最有效提升效能。
At the bottom of all tabs except Summary, you will also see a list of CPU threads started by the engine along with the CPU utilization for each thread. This lets you see threads that can be a bottleneck at a given point in time.
備註
If you don't want the startup procedure to be included in the profile, you can also attach Hotspot to a running process by clicking Record Data then setting the Launch Application dropdown option to Attach To Process(es).
這種附加程序的方式和 VerySleepy 的操作流程很像。