Attention: Here be dragons
This is the latest
(unstable) version of this documentation, which may document features
not available in or compatible with released stable versions of Godot.
Checking the stable version of the documentation...
Instruments
也參考
Please see the sampling profiler instructions and the tracing profiler instructions for more information.
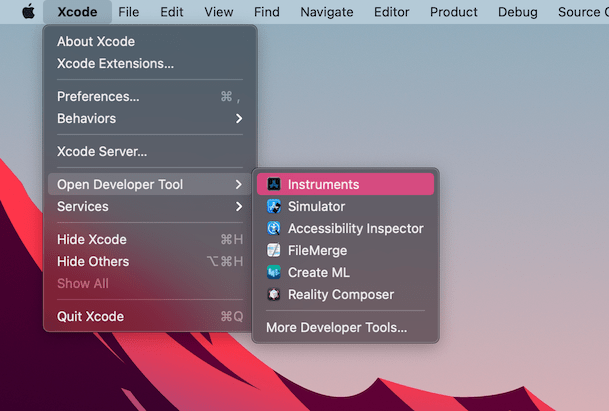
Open Xcode. Select Open Developer Tool - Instruments from the Xcode app menu:
在 Instruments 視窗中雙擊 Time Profiler:
In the Time Profiler window, click on the Target menu, select Choose target... and specify the path to the Godot binary, command line arguments, and environment variables in the next window.
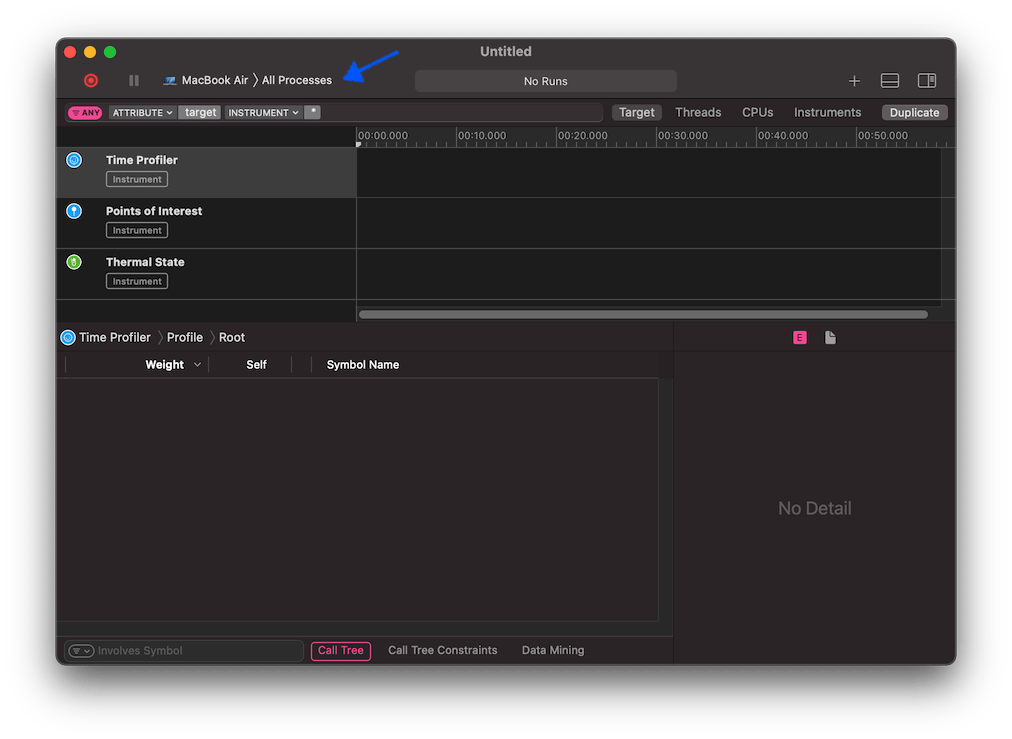
你也可以從 Target 選單將 Time Profiler 附加到正在執行的程序。
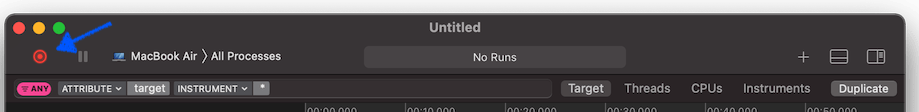
點選 Start an immediate mode recording 按鈕開始效能分析。
在編輯器或專案中執行要分析的操作,完成後點選 Stop 按鈕。
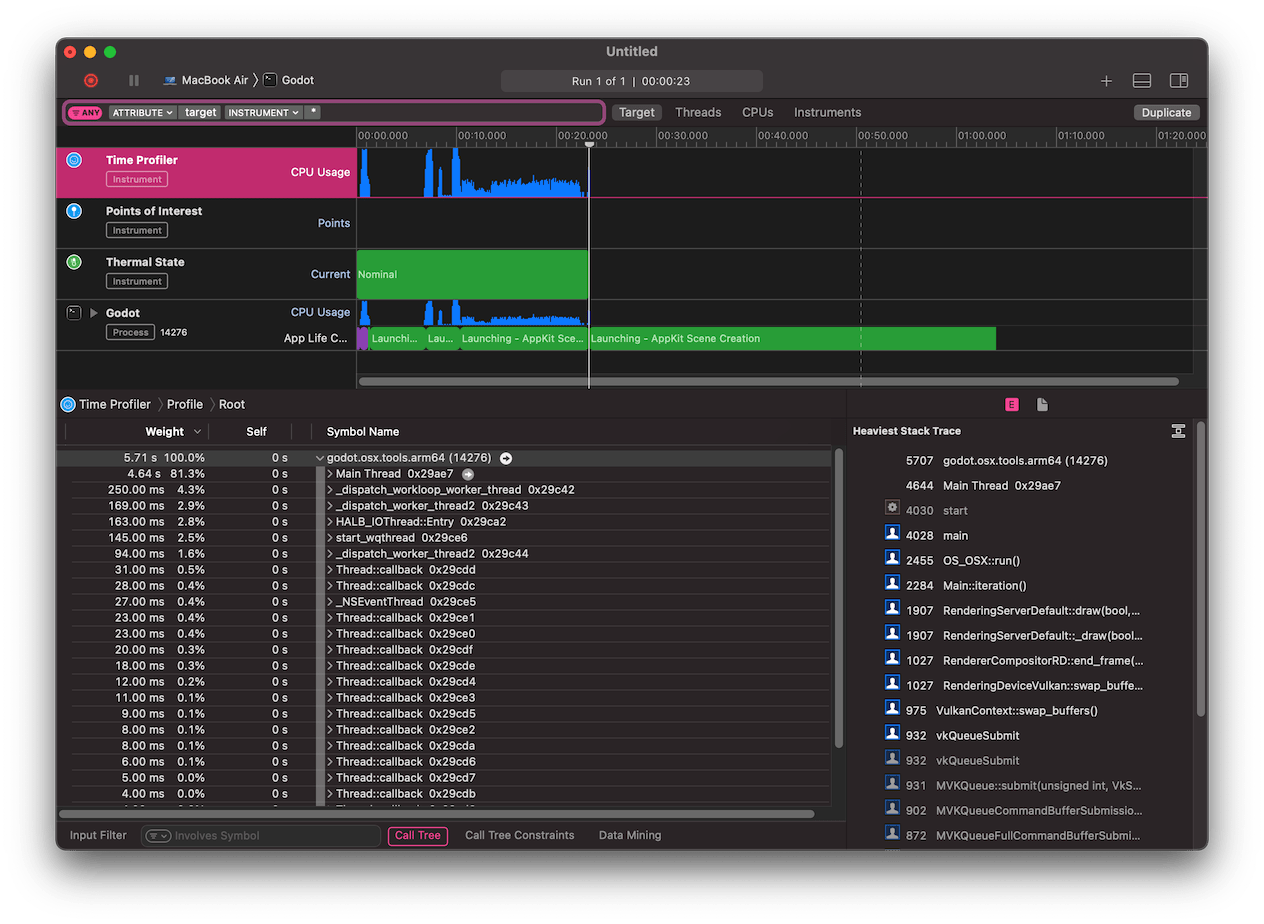
等待結果顯示。
在視窗底部會看到所有已啟動 CPU 執行緒的呼叫樹,以及 Heaviest Stack Trace 概覽。
Select Hide system libraries in the Call Tree menu (at the bottom of the window) to remove external modules.
你可以利用視窗上方的時間軸,檢視特定時間區間的詳細資訊。