Up to date
This page is up to date for Godot 4.2.
If you still find outdated information, please open an issue.
使用 C++ 性能分析器
要优化 Godot 的性能,你首先得知道要优化什么,性能分析器在这方面非常有用。
备注
There is a built-in GDScript profiler in the editor, but using C++ profiler may be useful in cases where the GDScript profiler is not accurate enough or is missing information due to bugs in the profiler.
性能分析器推荐
VerySleepy (仅适用于 Windows)
HotSpot (仅适用于 Linux)
Xcode Instruments (仅适用于 macOS)
这些性能分析器可能不是最强大或者最灵活的,但它们独立的操作和有限的功能非常易用。
设置 Godot
如果要获取有用的性能分析信息,就必须使用包含调试符号的 Godot 构建。官方二进制文件并不包含调试符号,因为会显著增加文件下载大小。
如果想要获取与生产环境最接近的性能分析数据,你应该使用如下 SCons 选项来编译程序。
It is possible to run a profiler on less optimized builds (e.g. target=template_debug without LTO),
but results will naturally be less representative of real world conditions.
警告
请勿在编译完成后使用 strip 命令剥离调试符号,否则运行性能分析器时无法得到有用的信息。
测量启动/关闭耗时
如果想要尝试优化 Godot 的启动/关闭性能,你可以让分析器使用 Godot 二进制文件的 --quit 命令行参数,它会让 Godot 在启动完成后立即退出。--quit 参数可以和 --editor、--project-manager、--path <项目目录路径>(该参数可以直接运行项目)搭配使用。
参见
更多 Godot 支持的命令行参数见 命令行教程。
性能分析器指令
VerySleepy
Start the Godot editor or your project first. If you start the Project Manager, make sure to edit or run a project first. Otherwise, the profiler will not track the child process since the Project Manager will spawn a child process for every project edited or run.
打开 VerySleepy 然后在左侧的进程列表中选中 Godot 程序:
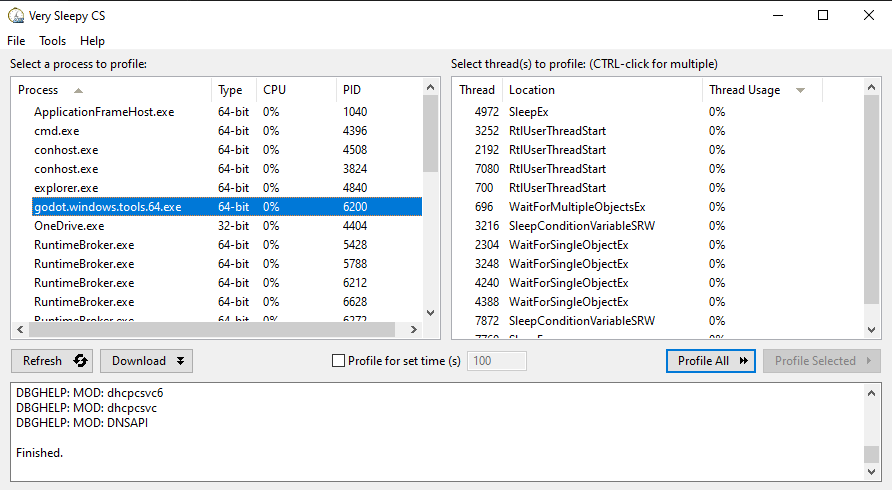
点击右侧的 Profile All 按钮开始性能分析。
在编辑器或者项目中执行你想分析性能的操作,完成后点击 Stop(注意不是 Abort)。
等待出现结果窗口。
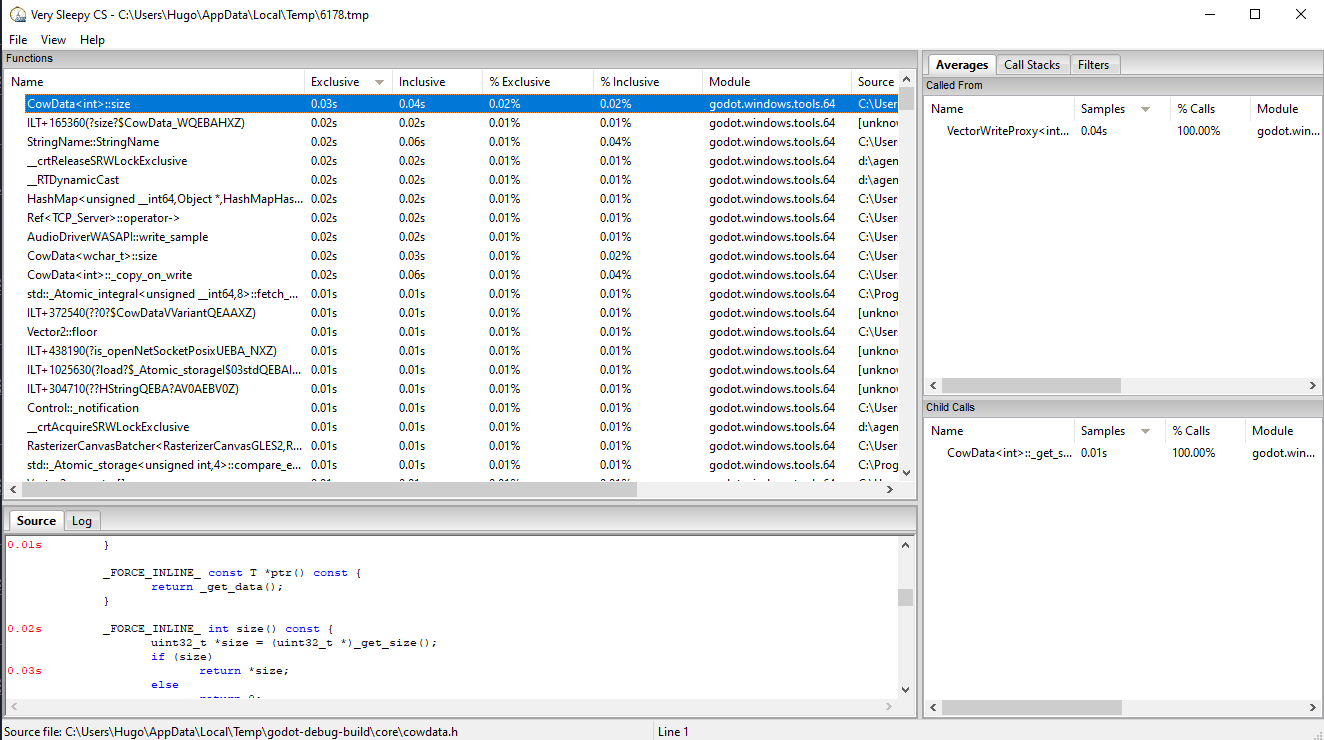
结果窗口出现后,在视图中筛选掉外部模块(例如图形驱动)。筛选模块的方法是,首先找到 Module 和 Godot 可执行文件名称一致的行,在那一行上单击右键,然后在下拉菜单中选择 Filter Module to <Godot 可执行文件名> 。
结果窗口现在应该类似这样:
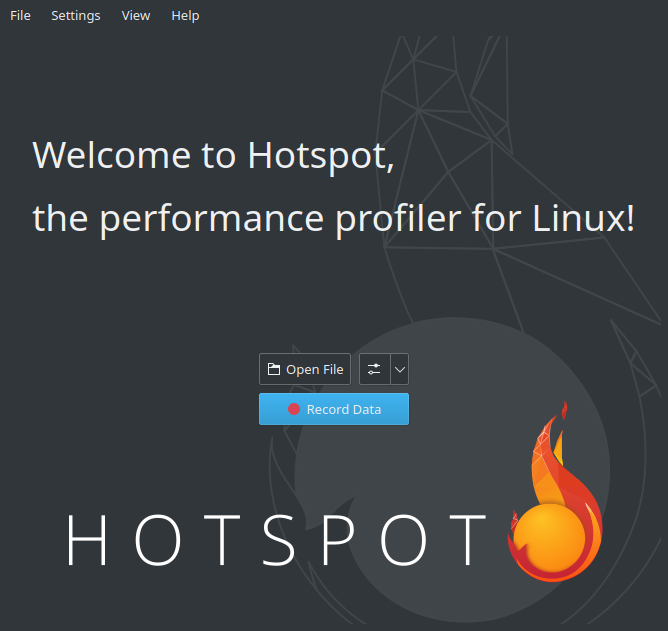
HotSpot
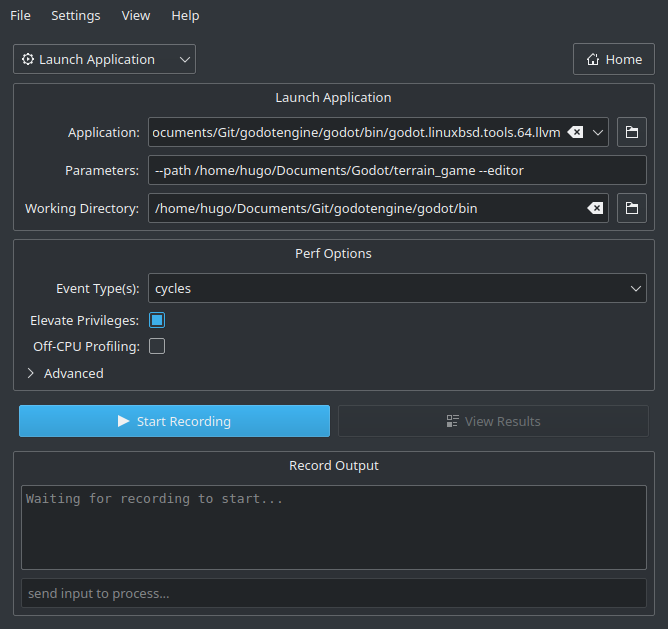
打开 HotSpot。点击 Record Data:
在下一个窗口中,指定包含调试符号的 Godot 可执行文件的路径。
指定运行项目所使用的命令行参数,用不用编辑器运行都行。
如果
--path参数使用的是绝对路径,那么工作目录的路径可以任选。否则应该可以在工作目录使用相对路径访问项目。如果你有管理员权限,请勾选 Elevate Privileges(提升权限)。虽然不是对 Godot 进行性能分析所必需的,这样做可以保证捕捉到所有事件,否则有些事件可能会被漏掉。你的设置现在应该类似这样:
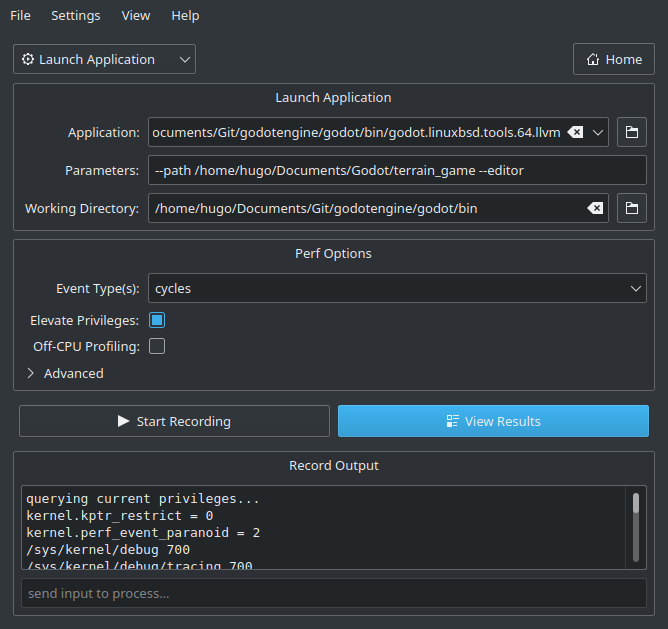
点击 Start Recording 然后在编辑器或者项目中执行需要分析性能的操作。
你可以正常退出编辑器或者项目,也可以点击 HotSpot 里的 Stop Profiling 按钮来提前停止性能分析。如果你不在乎引擎本身的关闭过程,提前结束性能分析可以让分析结果更干净。
点击 View Results 然后等待生成可视化性能分析结果:
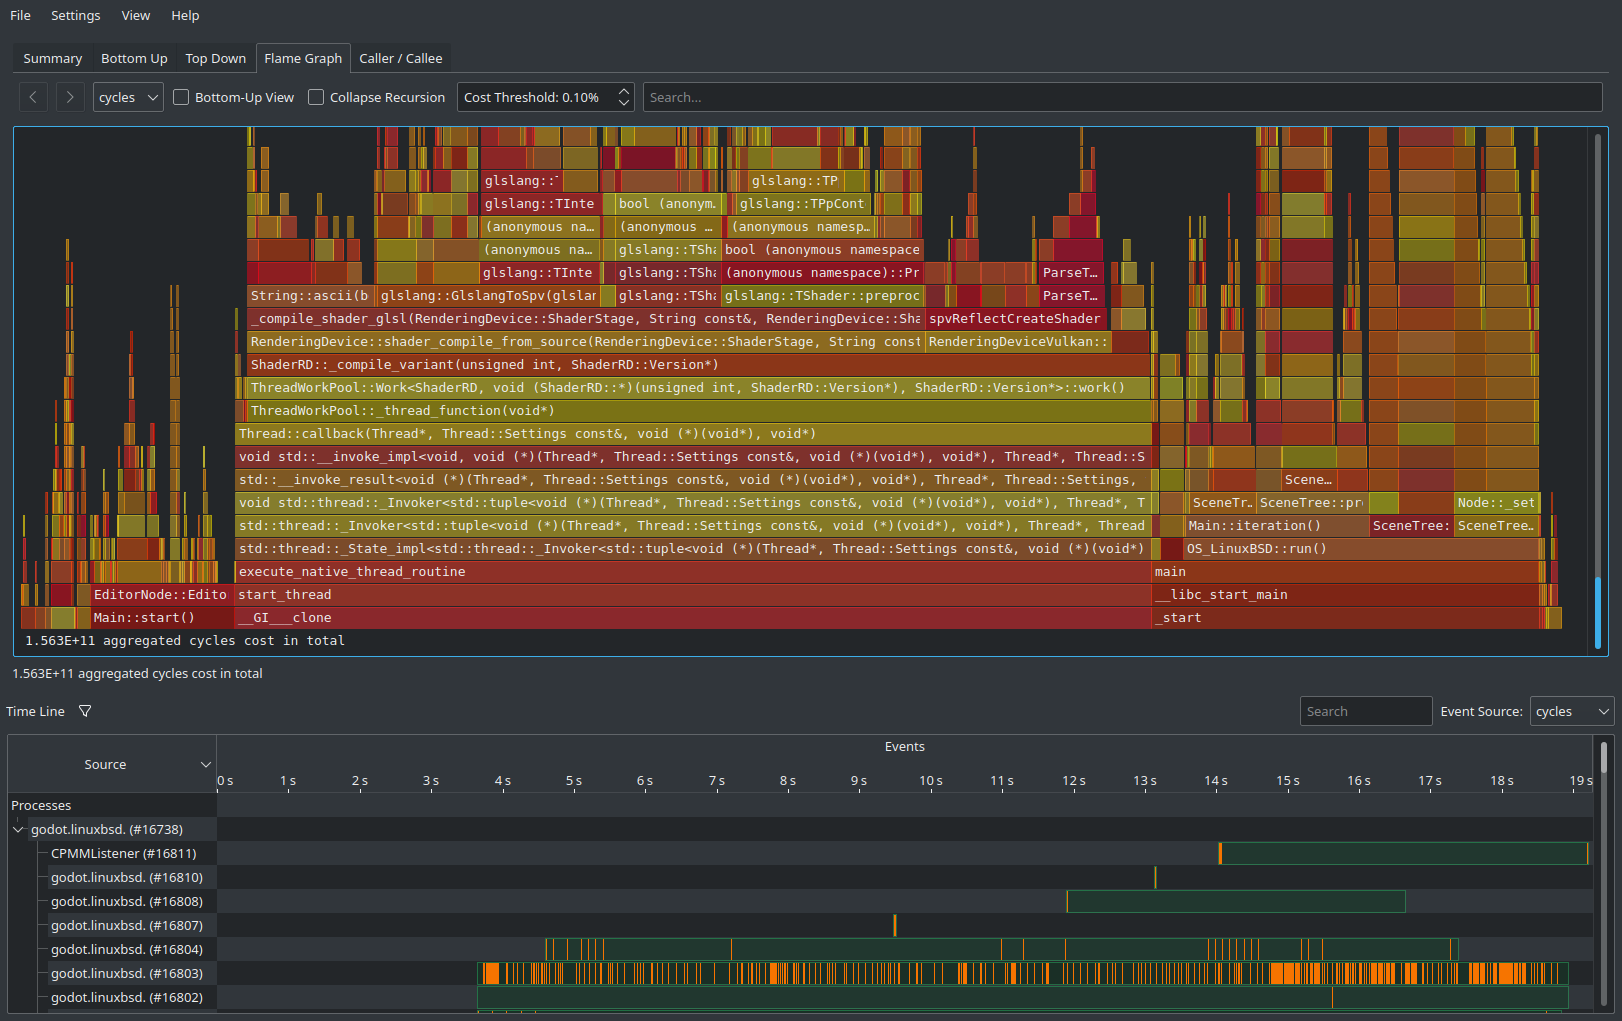
使用顶部的选项卡可以切换不同的视图,这些视图是用不同的方式显示相同的数据。 Flame Graph(火焰图) 选项卡里可以很直观地找到哪些函数占用的时间最长。这些函数就是终点优化对象了,因为优化后可以显著提升性能。
除了 Summary 的其它选项卡底部都有一个引擎所开启的 CPU 线程列表,每个线程都列出了对应的 CPU 使用情况。你可以据此查看在特定时间点的瓶颈线程。
备注
如果你不希望启动过程被包含在性能分析之中,也可以把 HotSpot 附加到正在运行的进程上,点击 Record Data 然后把 Launch Application 下拉选项设置成 Attach To Process(es) 即可。
这样基于附加到进程的工作流和 VerySleepy 比较类似。
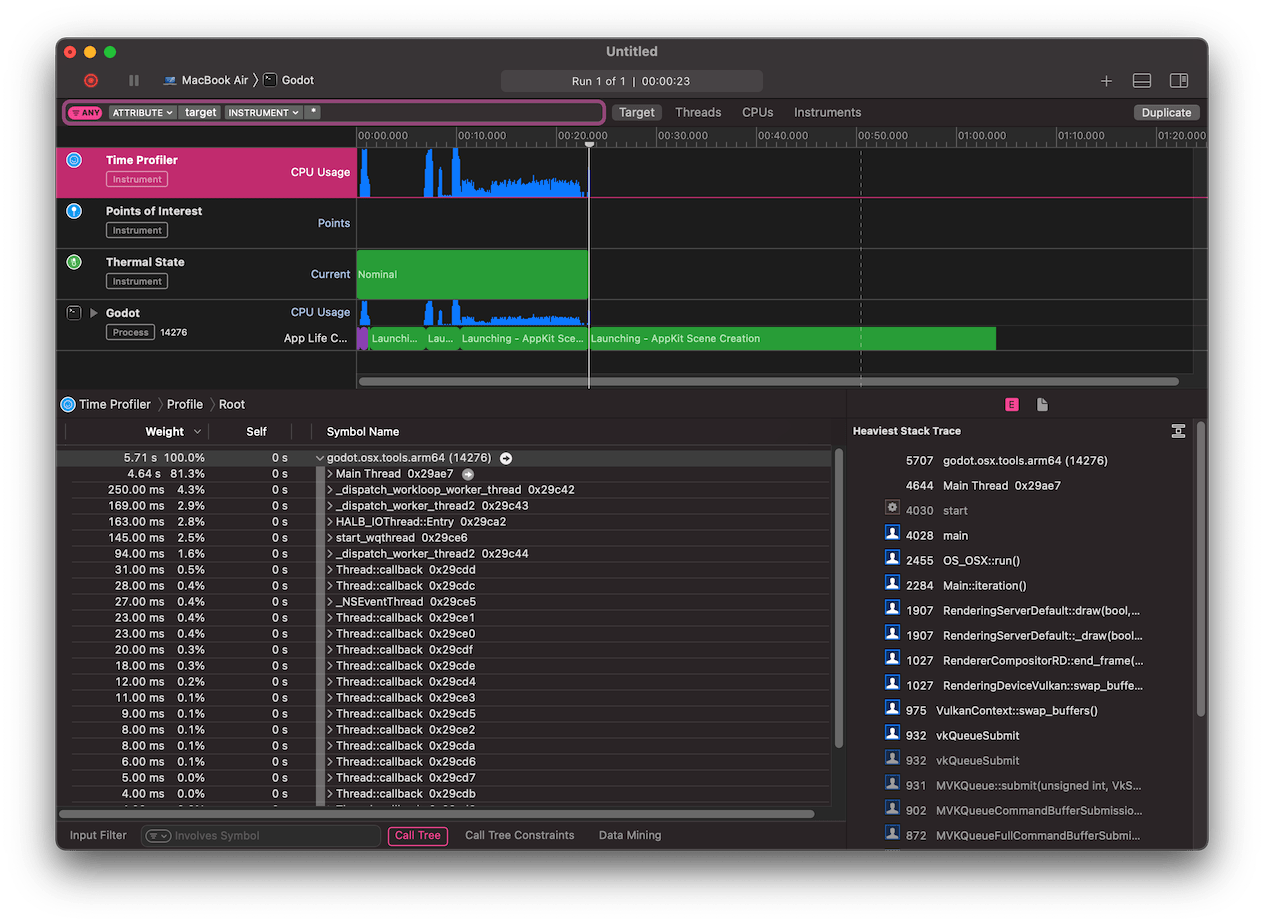
Xcode Instruments
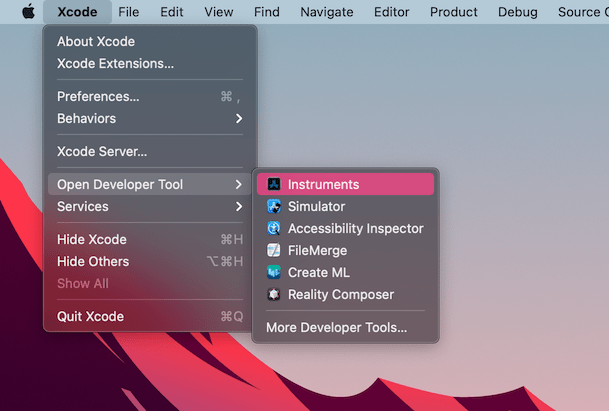
打开 Xcode,在 Xcode 应用菜单中选择 Open Developer Tool - Instruments :
双击 Instruments 窗口中的 Time Profiler :
在 Timer Profiler 窗口中,点击 Target 菜单,选择 Choose target... 然后将路径设置为 Godot 可执行文件的路径,在下一个窗口中设置命令行参数和环境变量。
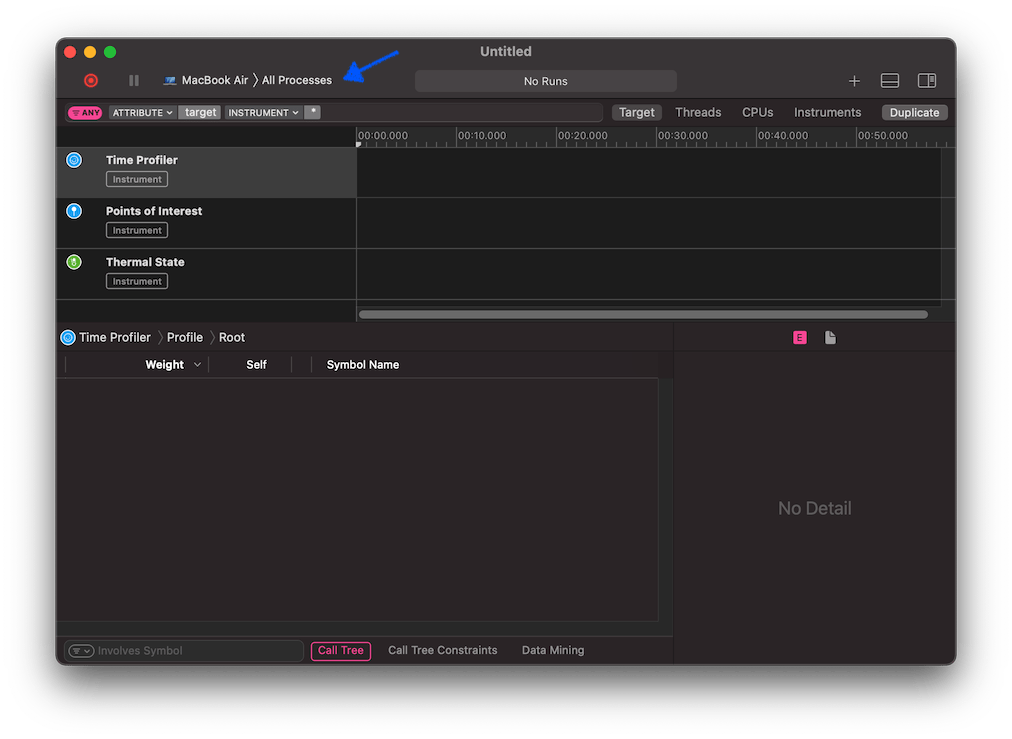
你也可以把 Time Profiler 附加到正在运行的进程上,在 Target 菜单中选择即可。
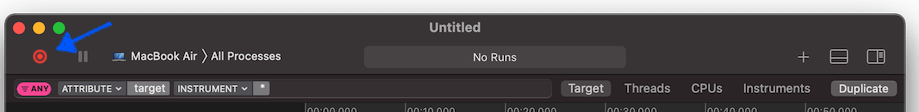
点击 Start an immediate mode recording 按钮开始性能分析。
在编辑器或者项目中执行要分析性能的操作,完成后点击 Stop 按钮。
等待结果出现。
窗口底部会显示所有被启动的 CPU 线程的调用树,以及一个 Heaviest Stack Trace 总览。
在(窗口底部的) Call Tree 菜单中选择 Hide system libraries 可以移除外部模块。
你可以使用窗口顶部的时间线来控制只显示特定时间段内的详细信息。