Attention: Here be dragons
This is the latest
(unstable) version of this documentation, which may document features
not available in or compatible with released stable versions of Godot.
Checking the stable version of the documentation...
调试工具概述
本指南将概述引擎中可用的调试工具.
Godot自带强大的调试器和剖析器, 可以追踪bug, 在运行时检查你的游戏, 监控重要指标, 并测量性能. 它还提供了在运行游戏中可视化碰撞框和导航多边形的选项.
最后, 你可以选择调试在远程设备上运行的游戏, 并在游戏运行时重新加载对你的场景或代码的修改.
输出面板
输出面板允许你查看项目输出的文本,也可以查看编辑器输出的文本(例如来自 @tool 脚本的文本)。有关它的更多信息,请参阅 输出面板。
调试器面板
Godot 的许多调试工具都是“调试器”面板的一部分,你可以在 调试器面板 中找到相关信息。
调试菜单选项
在编辑器中运行游戏时, 有几个常见的调试选项可以切换为开或关, 以帮助你调试游戏.
你可以在编辑器菜单调试中找到这些选项。
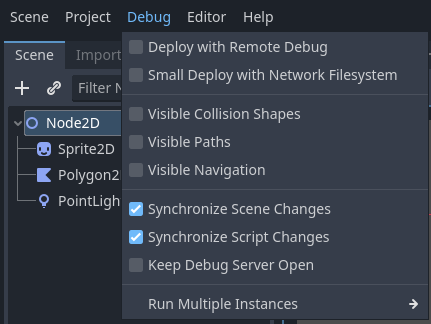
下面是这些选项的说明:
使用远程调试部署
启用此选项后,使用一键部署时,可执行文件将尝试连接到此计算机的 IP,以便调试正在运行的项目。此选项旨在用于远程调试(通常用于移动设备)。如果在本地使用 GDScript 调试器,则不需要启用此选项。
使用网络文件系统进行小型部署
这个选项加快了在远程设备上进行大足迹游戏的测试.
当开启 Small Deploy with Network Filesystem (带网络文件系统的小型部署)时,部署游戏将不再导出完整的游戏包,而是只构建一个极简的可执行文件。随后,编辑器会通过网络将项目中的文件实时提供给这个可执行文件。
另外,在 Android 系统上,游戏采用 USB 线部署,加快部署速度。
显示碰撞区域
启用该选项后,碰撞形状和射线检测节点(2D 和 3D)将在运行中的项目中可见。
显示路径
启用该选项时,路径节点的曲线资源将在项目运行时可见。
显示避障
启用该选项时,避障对象的形状、半径、速度都将在项目运行时可见。
调试 CanvasItem 重绘
启用该选项时,2D 对象的重绘请求将在项目运行时可见(短暂的闪光)。可用于低处理器模式下的故障排除。
同步场景修改
启用该选项时,在编辑器中对场景的任何修改都会被应用于正在运行的项目中。当使用于远程设备时,启用网络文件系统能提高编辑效率。
同步脚本修改
启用该选项时,任何保存的脚本都会被正在运行的项目重新加载。当使用于远程设备时,启用网络文件系统能提高编辑效率。
调试服务器保持开放
启用该选项时,编辑器的调试服务器将保持开放,监听在编辑器本身之外开始的新会话。
自定义运行实例...
这会打开一个窗口,允许你指定 Godot 同时运行游戏的多个实例,并指定每个实例的命令行参数。这在构建和调试多人游戏时尤其有用。

启用多实例
该选项启用后,运行项目时会同时运行多个实例。
该勾选框下有选择器,用于指定同时运行实例的数量。
勾选后将该数值设定为 1 等价于不勾选。
主要运行参数
这些参数将在你运行项目时传递给每一个项目实例,除非你为特定实例选择了“Override Main Run Args”下的“Enabled”选项。
请注意,这些参数是以空格分隔的。
小技巧
你可以通过使用 get_cmdline_args 在脚本中访问这些参数。
警告
即使你取消勾选“Enable Multiple Instances”,在运行项目时,这些参数仍然会被传递。
覆盖主要运行参数
启用此选项后,在运行项目时,“主要运行参数”中的参数不会传递给该特定实例。
启动参数
这些是在你运行项目时传递给该特定实例的参数。它们将与 “Main Run Args” 组合使用,除非你选择了 “Override Main Run Args” 下的 “Enabled” 选项。
脚本编辑器调试工具和选项
脚本编辑器有自己的一套调试工具,用于断点和两个选项。断点工具也可以在调试器的调试器选项卡中找到。
小技巧
你可以通过点击脚本编辑器左侧的装订线(位于行号左边)来创建断点。当鼠标悬停在该装订线上时,你会看到一个透明的红点出现;点击放置断点后,它会变成不透明的红点。再次点击该红点即可移除断点。通过这种方式创建的断点会在编辑器重新启动后保留,即使退出编辑器时脚本尚未保存也是如此。
你还可以在 GDScript 中使用 breakpoint 关键字来创建直接存储在脚本中的断点。与通过点击装订线创建的断点不同,这种基于关键字的断点在使用版本控制时可以在不同机器之间保持一致。
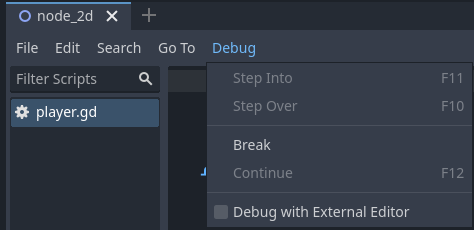
断点 按钮会像断点一样导致脚本的中断. 继续 使游戏在断点处暂停后继续. Step Over 进入下一行代码, 如果可能的话, Step Into 进入一个函数. 否则, 它与 Step Over 做同样的事情.
Debug with External Editor 选项允许你使用外部编辑器调试游戏。你可以在 Editor Settings > Shortcuts > Debugger 中为它设置快捷键。
当调试器在断点处中断时,脚本编辑器的排水沟中会显示一个绿色的三角箭头。此箭头表示调试器中断的代码行。
调试项目设置
在项目设置中,有一个 Debug 类别,其中包含多个用于控制不同功能的子类别。启用 Advanced Settings 后即可修改这些设置。
Settings(设置)
这些都是一些常规的设置,比如将当前的 FPS 打印到输出面板,剖析时的最大函数量等。
文件日志记录
这些设置允许你将控制台输出和错误信息记录到文件中。
GDScript
这些设置允许你切换特定的 GDScript 警告,例如未使用变量警告。你也可以完全关闭警告。更多信息请参阅 GDScript 警告系统。
着色器语言
这些设置允许你切换特定的着色器警告,比如未使用的变量。你也可以完全关闭警告。
画布项(CanvasItem)
这些设置用于画布项(canvas item)重绘调试。
Shapes(形状)
Shapes中你可以调整形状的颜色, 这些形状只出现在调试的目的, 如碰撞和导航形状.
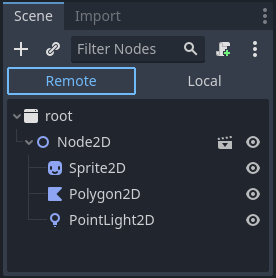
遥控场景面板
当在编辑器中运行游戏时,场景面板顶部会出现两个选项,即远程和本地。当使用远程时,你可以检查或改变运行项目中的节点参数。
备注
一些与调试有关的编辑器设置可以在 Editor Settings 内找到, 在 Network > Debug and Debugger 部分.