Attention: Here be dragons
This is the latest
(unstable) version of this documentation, which may document features
not available in or compatible with released stable versions of Godot.
Checking the stable version of the documentation...
自訂效能監控
前言
如 除錯器面板 說明,Godot 提供下方 除錯器 > 效能監控 分頁,可透過圖表追蹤各項數值隨時間變化。這些數據來自引擎的 Performance 單例物件。
Godot lets you declare custom values to be displayed in the Monitors tab. Example use cases for custom performance monitors include:
顯示專案特有的效能指標。例如體素遊戲可追蹤每秒載入的區塊數量。
記錄與效能無關但有助於除錯的遊戲指標。例如追蹤場上敵人數,檢查敵人產生機制是否正常。
建立自訂效能監控
本範例將建立一個自訂效能監控,追蹤當前專案中的敵人數量。
主場景中有一個 Timer 節點,附加以下腳本:
extends Timer


func _ready():
    # The slash delimiter is used to determine the category of the monitor.
    # If there is no slash in the monitor name, a generic "Custom" category
    # will be used instead.
    Performance.add_custom_monitor("game/enemies", get_enemy_count)
    timeout.connect(_on_timeout)
    # Spawn 20 enemies per second.
    wait_time = 0.05
    start()


func _on_timeout():
    var enemy = preload("res://enemy.tscn").instantiate()
    get_parent().add_child(enemy)


# This function is called every time the performance monitor is queried
# (this occurs once per second in the editor, more if called manually).
# The function must return a number greater than or equal to 0 (int or float).
func get_enemy_count():
    return get_tree().get_nodes_in_group("enemies").size()
Performance.add_custom_monitor 的第二個參數為 Callable。
enemy.tscn 是一個擁有 Node2D 根節點與 Timer 子節點的場景,Node2D 節點附有如下腳本:
extends Node2D


func _ready():
    add_to_group("enemies")
    $Timer.timeout.connect(_on_timer_timeout)
    # Despawn enemies 2.5 seconds after they spawn.
    $Timer.wait_time = 2.5
    $Timer.start()


func _on_timer_timeout():
    queue_free()
本例中,每秒產生 20 名敵人,每名敵人存活 2.5 秒,理論上場景內敵人數將穩定於 50。可透過監控圖表驗證此數值。
要檢視自訂效能監控的圖表,執行專案後切回編輯器,於下方 除錯器 > 效能監控 分頁中,捲動至新出現的 遊戲 分類,勾選 敵人,即可看到如下圖表:
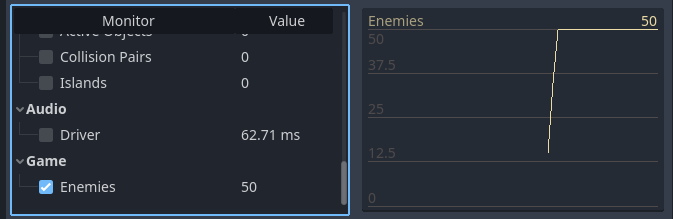
自訂效能監控於編輯器內的圖表示例
備註
效能監控相關程式碼不一定要寫在節點自身腳本內。也可將註冊與取值函式移到 autoload 中集中管理。
於專案中查詢效能監控數值
若你想在遊戲視窗(非編輯器)顯示監控數值,可用 Performance.get_custom_monitor("分類/名稱") 讀取。可用 Label、RichTextLabel、2D 中的自訂繪圖、3D 文字 等方式顯示。
此方法可用於匯出專案(除錯與發行模式),讓你在編輯器外也能顯示自訂效能圖表。