Attention: Here be dragons
This is the latest
(unstable) version of this documentation, which may document features
not available in or compatible with released stable versions of Godot.
Checking the stable version of the documentation...
Instruments
Ver también
Please see the sampling profiler instructions and the tracing profiler instructions for more information.
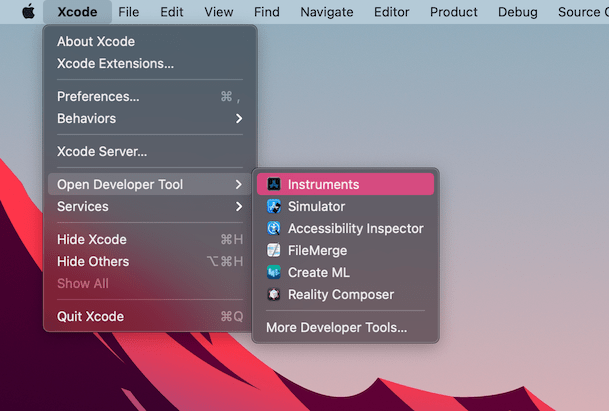
Open Xcode. Select Open Developer Tool - Instruments from the Xcode app menu:
Haz doble clic en Time Profiler (Perfilador de Tiempo) en la ventana de Instruments (Instrumentos):
In the Time Profiler window, click on the Target menu, select Choose target... and specify the path to the Godot binary, command line arguments, and environment variables in the next window.
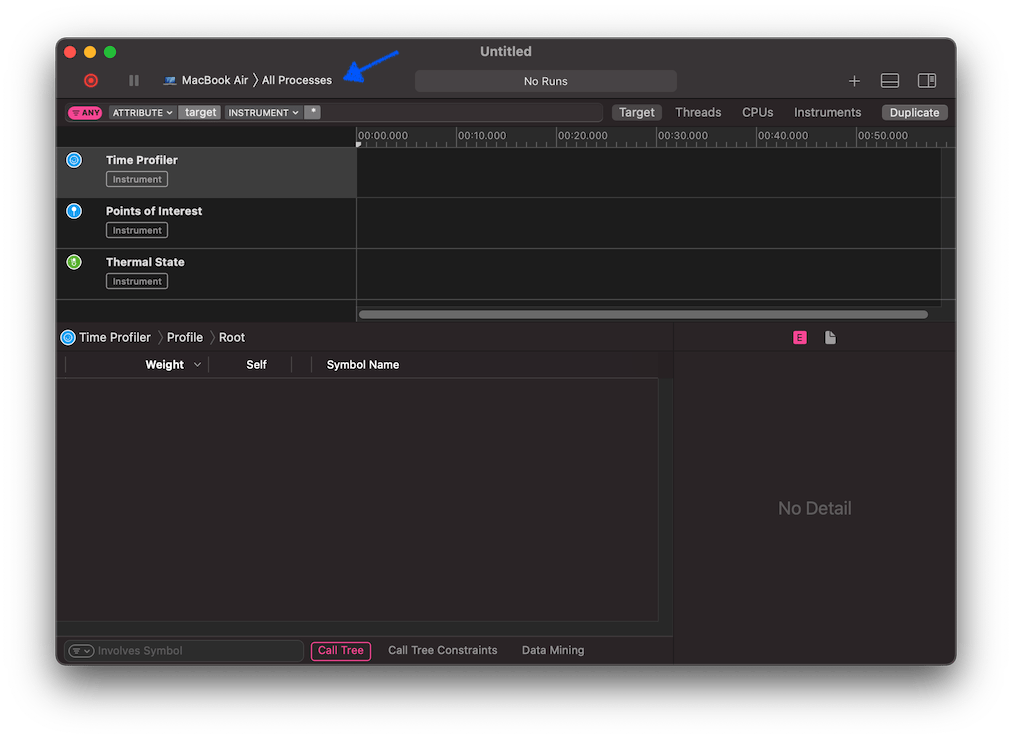
También puedes adjuntar el Time Profiler a un proceso en ejecución seleccionándolo desde el menú Target (Objetivo).
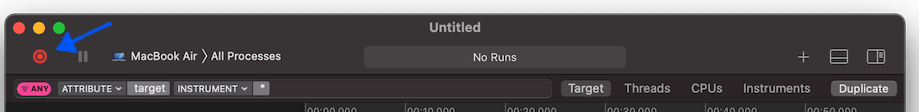
Haz clic en el botón Start an immediate mode recording (Iniciar una grabación en modo inmediato) para comenzar el perfilado.
Realiza las acciones que deseas perfilar en el editor o el proyecto. Cuando hayas terminado, haz clic en el botón Stop (Detener).
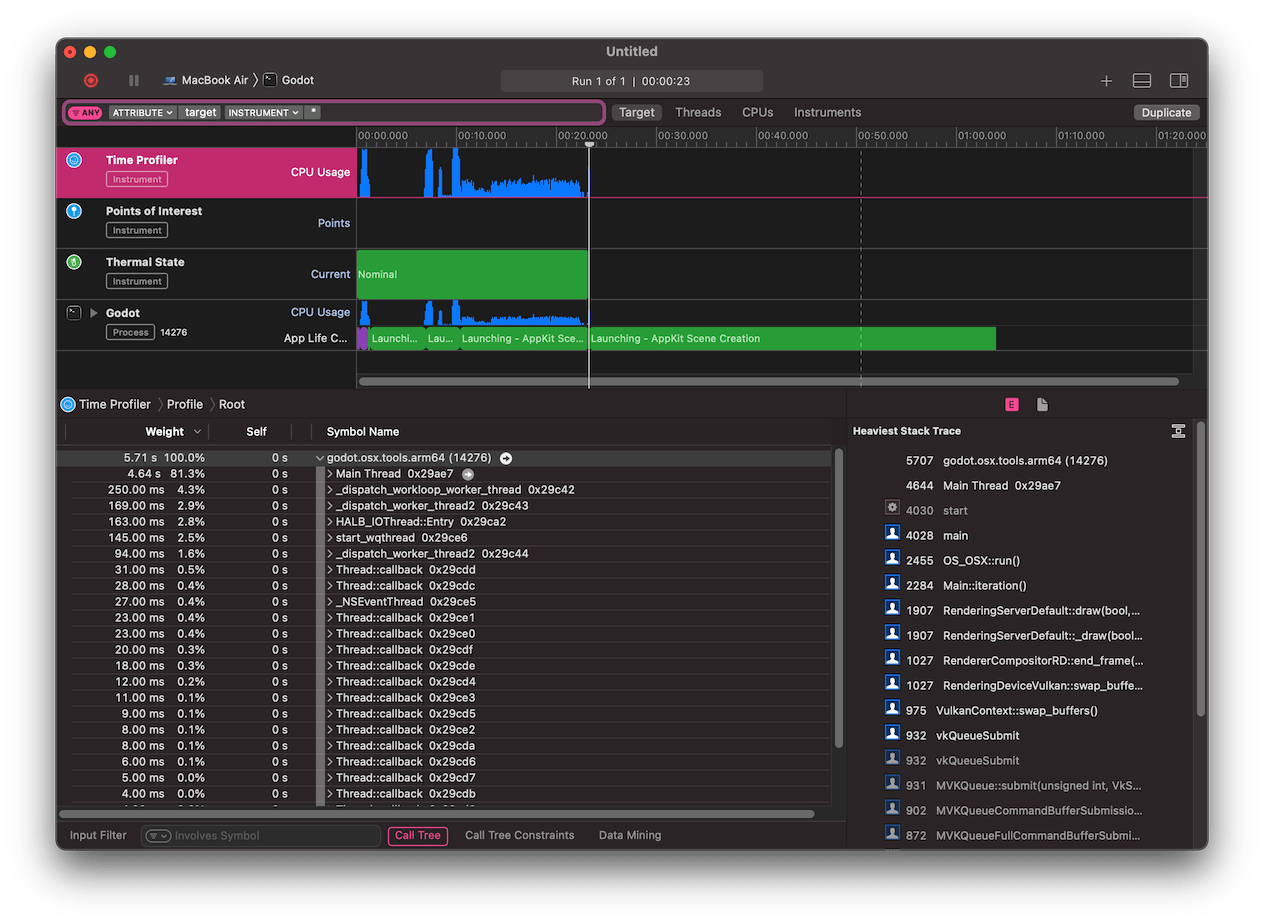
Espera a que aparezcan los resultados.
En la parte inferior de la ventana verás un árbol de llamadas para todos los hilos de la CPU iniciados, así como una descripción general de la Heaviest Stack Trace (Ruta de Pila más Pesada).
Select Hide system libraries in the Call Tree menu (at the bottom of the window) to remove external modules.
Puedes utilizar la línea de tiempo en la parte superior de la ventana para mostrar detalles para un período de tiempo específico.