Attention: Here be dragons
This is the latest
(unstable) version of this documentation, which may document features
not available in or compatible with released stable versions of Godot.
Checking the stable version of the documentation...
性能分析工具
参见
如需了解更多信息,请查阅 sampling profiler instructions 和 tracing profiler instructions。
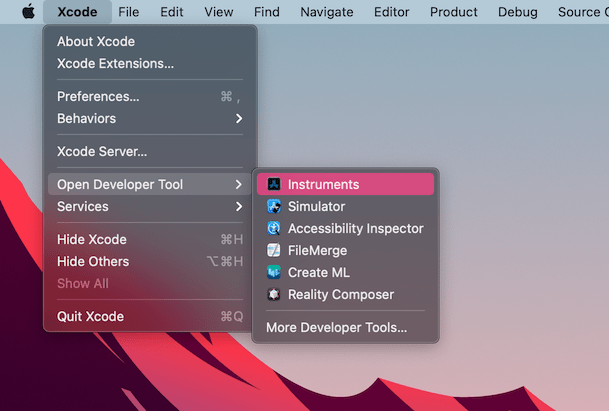
打开 Xcode。在顶部菜单栏的 Xcode 应用菜单中,依次选择 Open Developer Tool - Instruments :
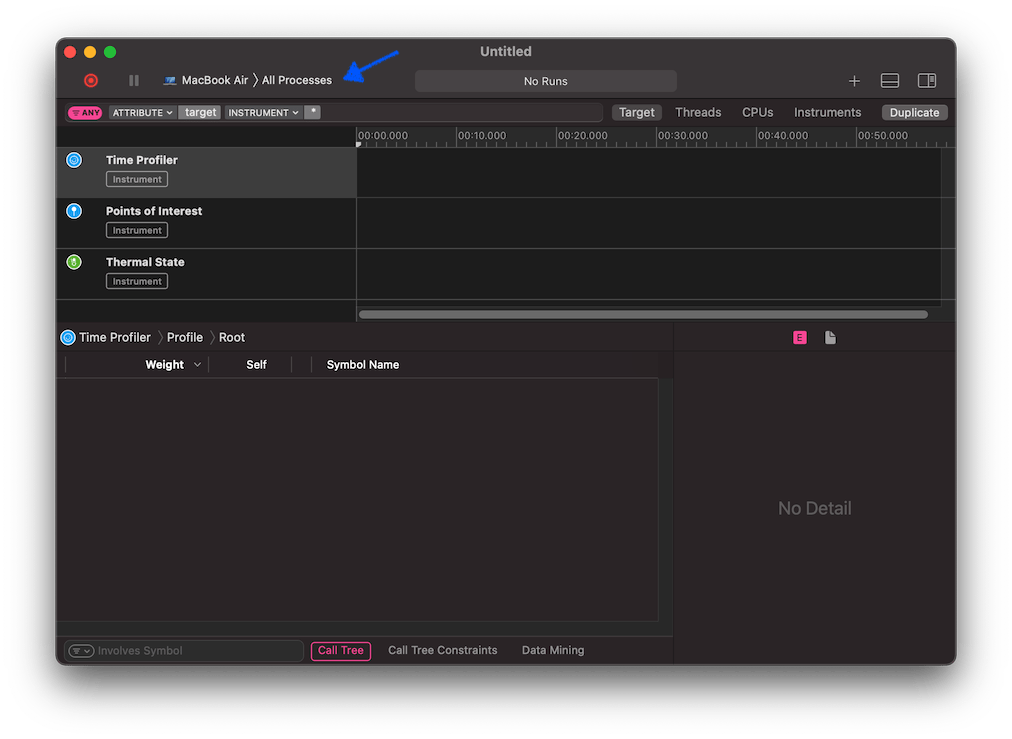
双击 Instruments 窗口中的 Time Profiler :
在‘时间分析器(Time Profiler)’窗口中,点击 Target (目标) 菜单,选择 Choose target... (选择目标...),然后在弹出的新窗口中指定 Godot 程序的路径、命令行参数以及环境变量。
你也可以把 Time Profiler 附加到正在运行的进程上,在 Target 菜单中选择即可。
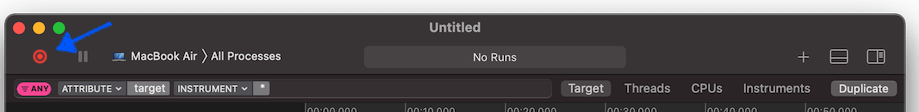
点击 Start an immediate mode recording 按钮开始性能分析。
在编辑器或者项目中执行要分析性能的操作,完成后点击 Stop 按钮。
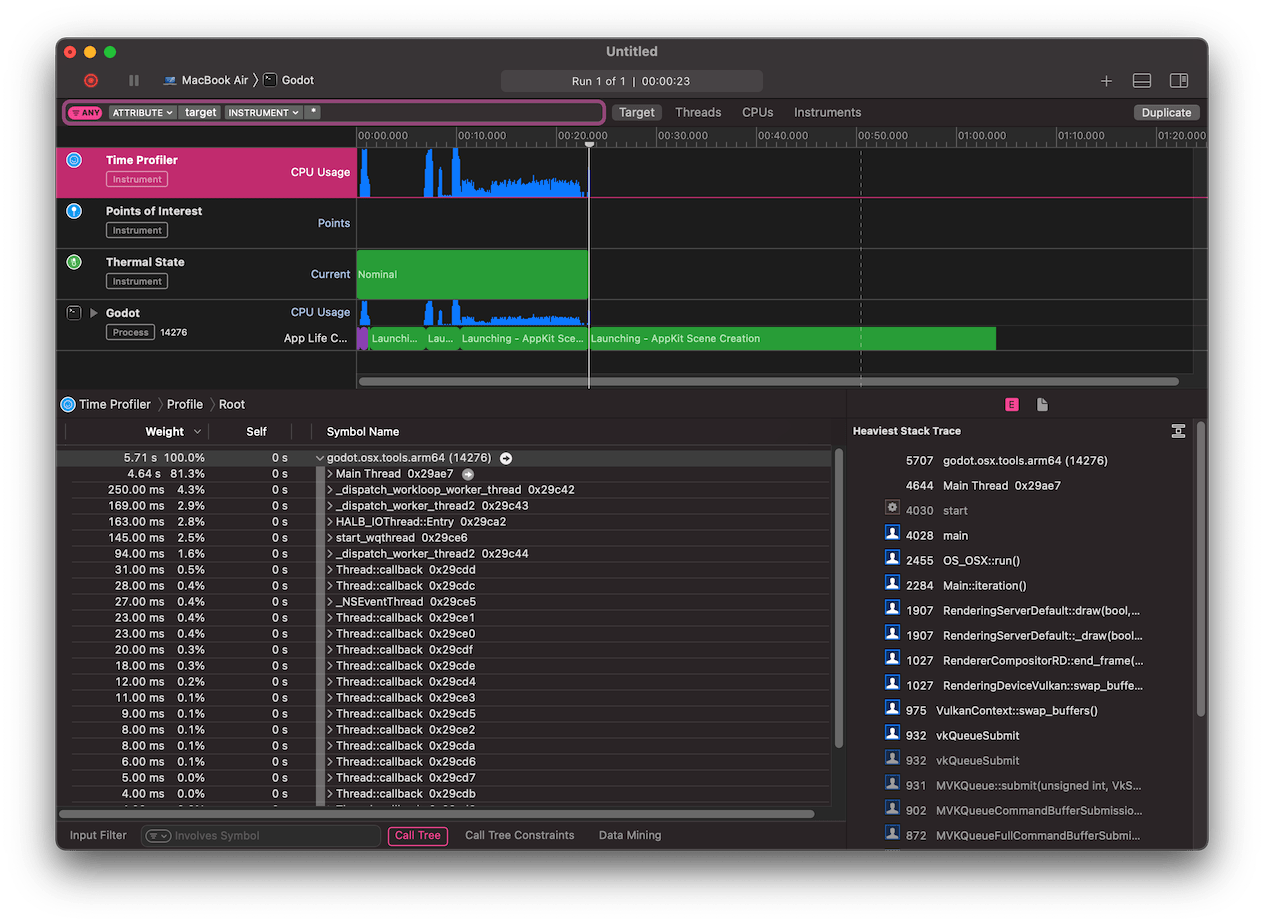
等待结果出现。
窗口底部会显示所有被启动的 CPU 线程的调用树,以及一个 Heaviest Stack Trace 总览。
在(窗口底部的) 调用树 (Call Tree)菜单中,勾选 隐藏系统库 (Hide system libraries),以移除外部模块。
你可以使用窗口顶部的时间线来控制只显示特定时间段内的详细信息。